Turn Usage Pricing Complexity Into Finance Clarity
Go to market with usage-based pricing with a single source of truth, from event ingestion through invoice to revenue recognition—driving accuracy, trust, and predictable growth.
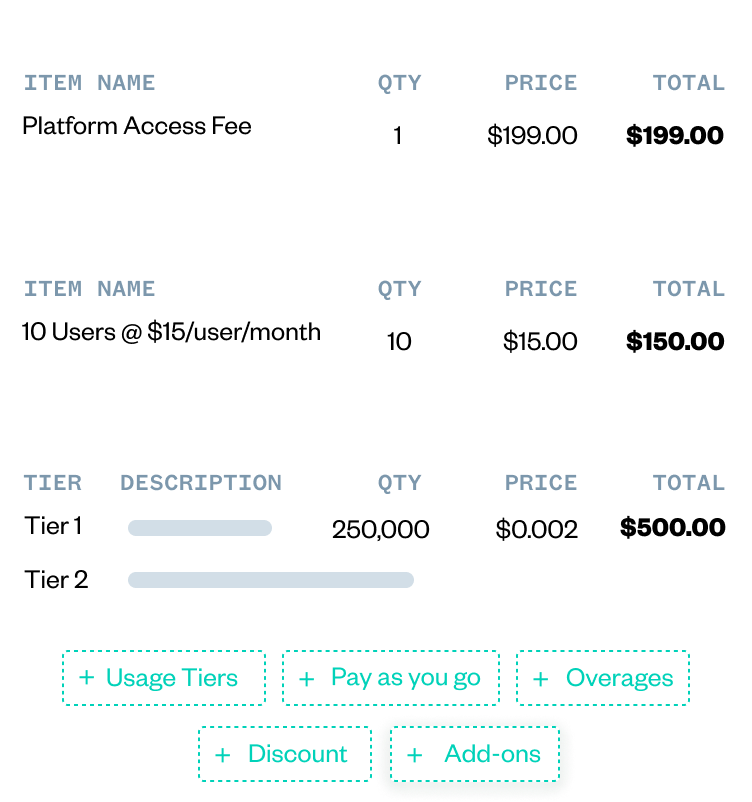
Create flexible usage pricing in a finance-aware product catalog
Configure usage models out of the box
Bring finance to the forefront of pricing
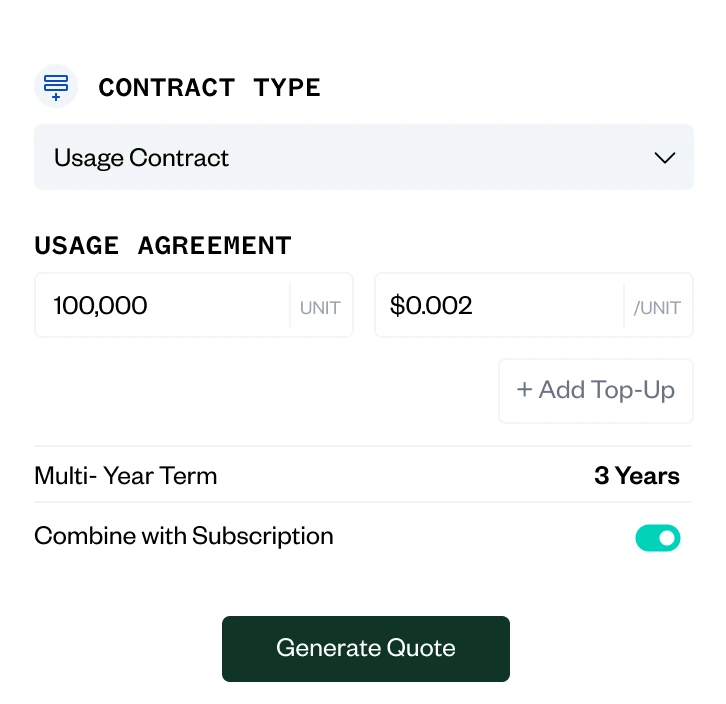
Enable sales to quote for usage-based offers
Support pay-as-you-go, prepaid, volume discounts, tiers, thresholds, overages, and commitment models with clicks not code.
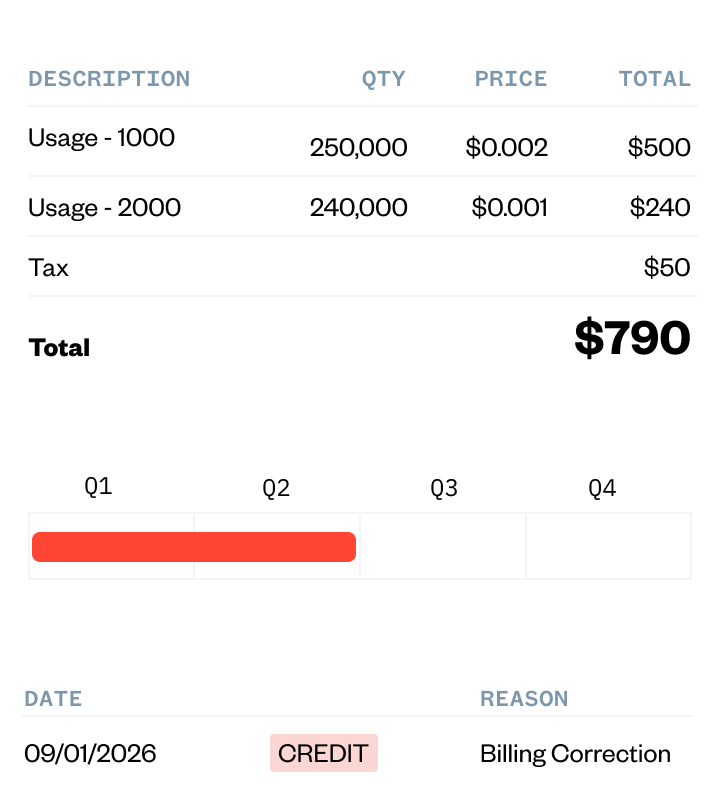
Configure usage pricing with accounting controls built in, so every invoice, recognition event, and adjustment can align seamlessly across order to cash
Ensure accuracy from the first sales order with the ability to quote usage contracts, add top-ups, create multi-year agreements, or bundle usage with subscriptions.
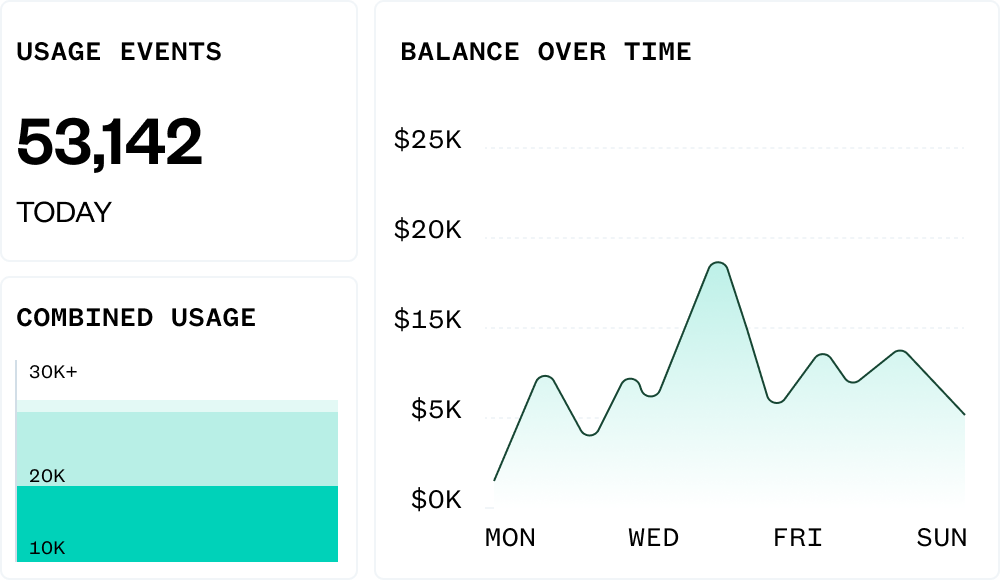
Visibility that builds trust: from ingestion to invoice to revenue.
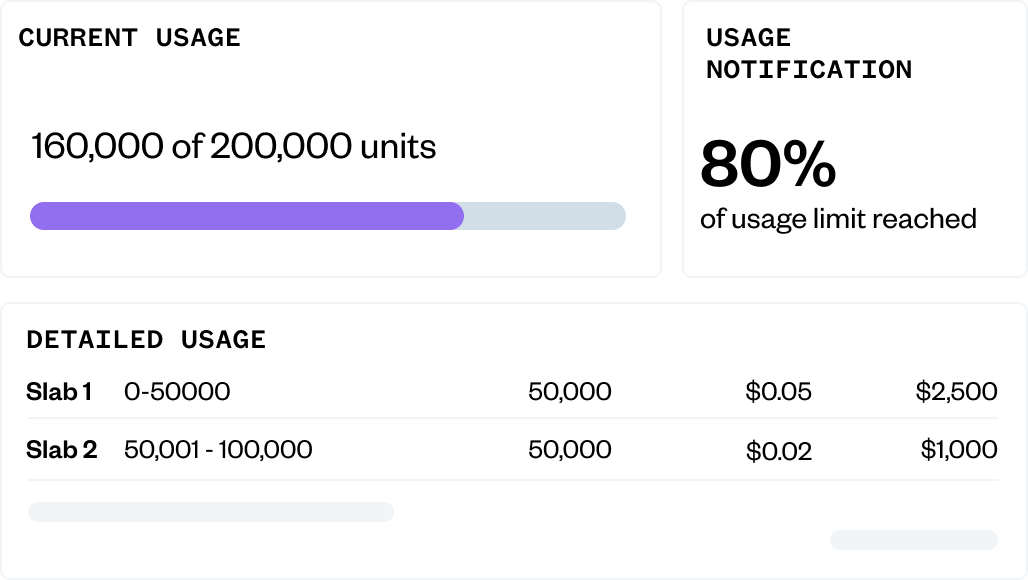
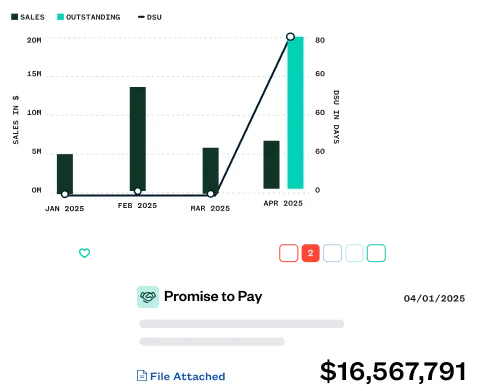
Monitor usage balances in real time Usage events are rated in real time, giving billing teams live insight into exactly how much each customer has used, even mid-cycle.
Build trust with customers through transparency Configurable widgets, real-time threshold notifications, alongside detailed usage invoices give customers control over their spend, avoid surprise overages, and reduce billing disputes.
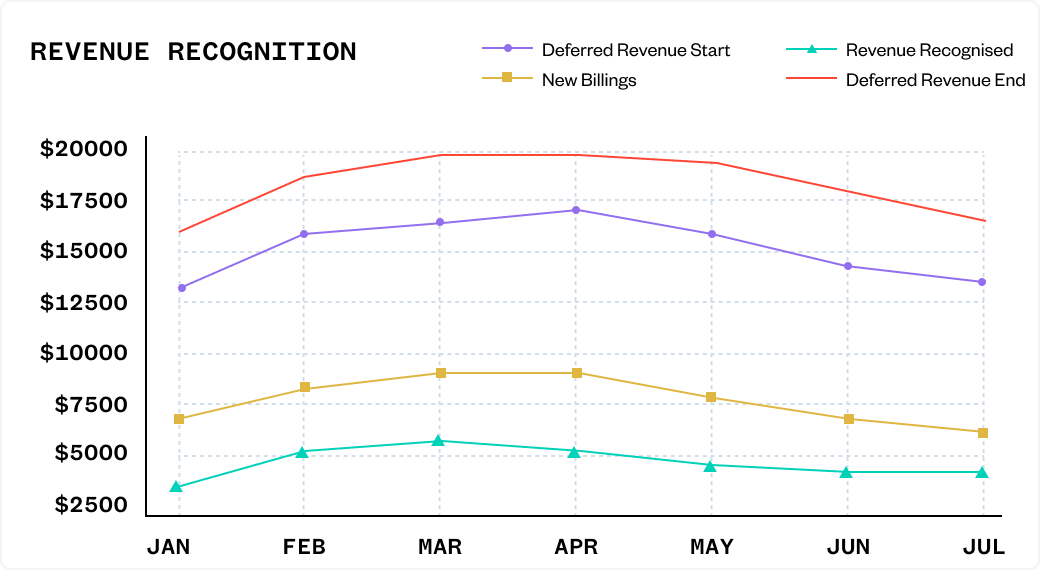
Simplify audits with usage waterfall reports Reduce manual reconciliation with a detailed, unified view of recognized and deferred revenue across pre-paid and committed usage contracts
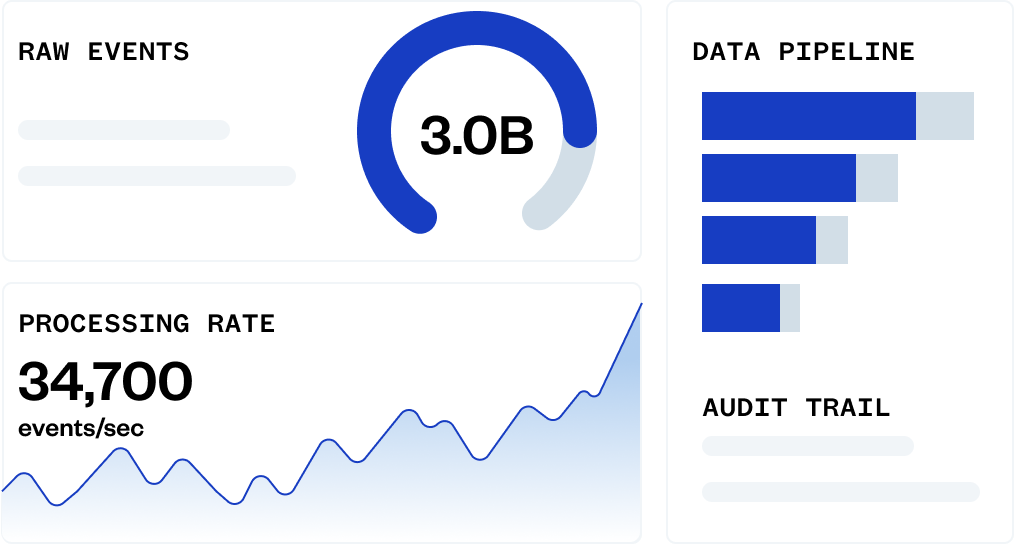
Accurately meter billions of daily usage events Align with your product service to directly ingest, enrich, aggregate, and transform events equipped with a full audit trail across the entire data pipeline. Scalable to 3B raw usage events per day
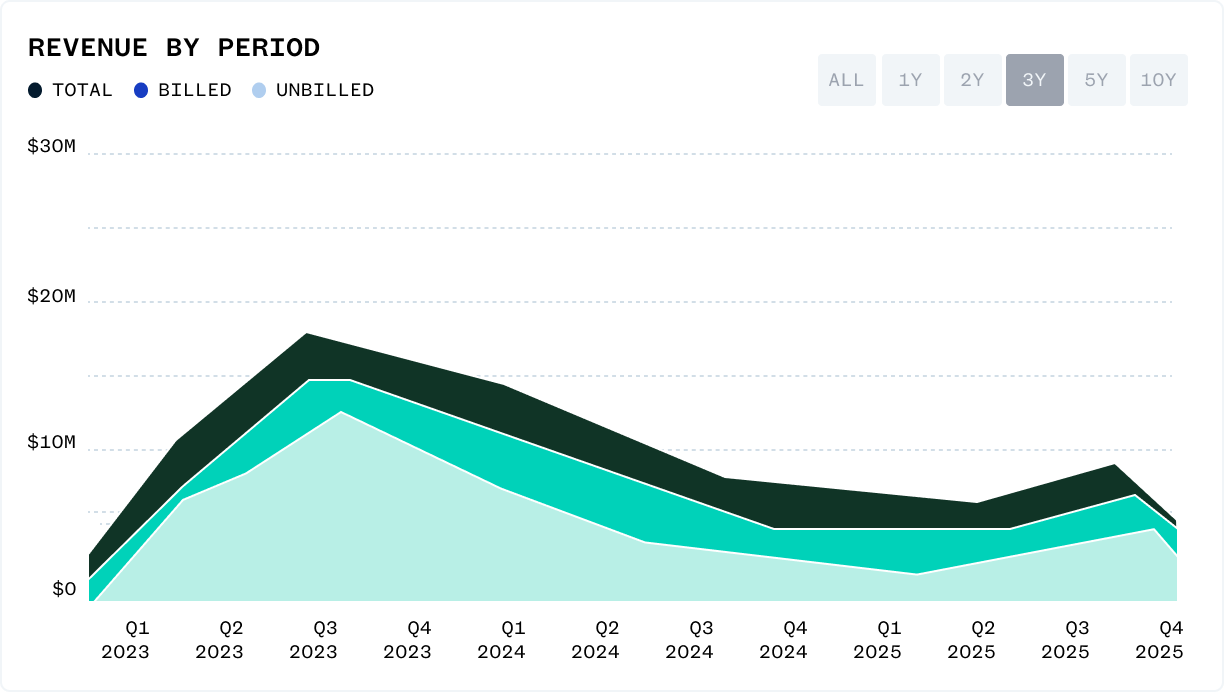
Recognize usage revenue as soon as an event is ingested Confidently estimate and adjust variable considerations based on actual, real time, usage data. Track usage revenue on a product-by-product basis
After outgrowing spreadsheets, Zoom adopted Zuora as their order-to-cash platform in 2015, before raising Series C. Zoom continues to run their multi-billion dollar business on Zuora today.
Read Case study
Zendesk became a Zuora customer in 2010 when they had 5000 accounts. They’ve scaled with Zuora through the years and continue to run their entire order-to-cash process on Zuora today.
Read Case study
“It’s reassuring to know that with Zuora we can continue to scale our business to meet the needs of our growing global customer base.”
Lauren Feeney, Financial Controller, Secureframe
Read Case study
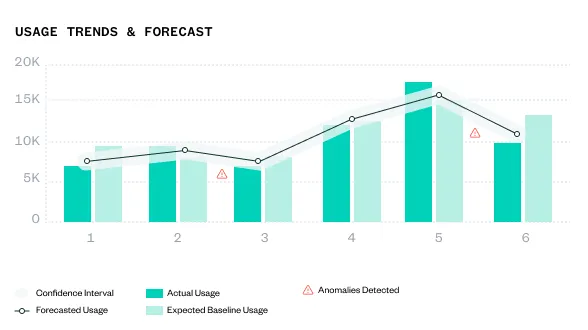
Forecast, predict, and refine with usage intelligence
Forecast usage, grounded in actual customer data
Leverage actual customer usage coupled with machine learning to accurately forecast and detect anomalies
Uncover growth opportunities with AI
AI-driven account scoring provides predictive scoring based on usage to proactively identity upsell opportunities or churn risk
Frequently Asked Questions Usage Based Pricing
What is usage based pricing software?
Usage based pricing software enables companies to set prices based on how much customers actually use a product or service such as API calls, bandwidth, or compute hours, instead of relying only on fixed recurring fees.
How does usage based pricing work in Zuora?
Zuora’s usage based pricing software collects and meters usage data in real time, applies your pricing models (tiered, block, or overage), and automatically turns that into accurate price calculations that feed invoices, forecasts, and compliant revenue recognition.
What types of usage contracts does Zuora usage based pricing software support?
Zuora’s usage based pricing software supports prepaid, committed, overage, and hybrid usage contracts, allowing you to combine consumption-based pricing with subscriptions or one-time fees in a single flexible agreement.
How does Zuora’s usage based pricing software handle revenue recognition?
Zuora’s usage based pricing software seamlessly handles revenue recognition by linking every usage event to accounting rules, automatically recognizing revenue in compliance with ASC 606 and IFRS 15 and giving finance teams daily, audit-ready visibility into earned revenue.
How does Zuora usage based pricing software handle usage disputes or pricing discrepancies?
Zuora’s usage based pricing software handles usage disputes and pricing discrepancies by providing full transparency into every metered event and rated amount, so you can trace each price back to its source data and resolve disputes with confidence.
Can customers view their usage and projected costs in real time with Zuora usage based pricing platform?
Yes, customers can view their usage and projected costs in real time with Zuora usage based pricing platform. It lets you embed real-time usage dashboards in customer portals or CRMs, showing billed and unbilled usage, thresholds, and forecasted charges based on your pricing models.
How can I forecast revenue with Zuora’s usage based pricing software?
You can easily forecast revenue with Zuora’s usage based pricing software via the platform’s forecasting and simulation tools that project future usage revenue based on historical trends and live metering data, helping finance teams model growth and cash flow accurately.
Is Zuora usage based pricing software compliant and auditable?
Yes, Zuora’s usage based pricing software is fully compliant and auditable. Every usage record, rating rule, price, invoice, and revenue entry is tracked end to end, ensuring auditability, compliance, and full traceability across your entire pricing, billing, and revenue lifecycle.
What’s the best usage based pricing software?
The best usage based pricing software should include real-time metering, flexible pricing engines for tiered and hybrid models, automated rating and revenue recognition, global currency and tax support, forecasting, and audit-ready compliance. Zuora’s usage based pricing software includes all these features — built to scale from startups to global enterprises.
How do I get started with usage based pricing software in Zuora?
Getting started with usage based pricing in Zuora is easy. Simply request a demo or talk to a Zuora expert in usage based pricing. Setup includes defining your usage metrics, configuring pricing tiers and charge models, integrating metering data sources, and automating pricing, billing, and revenue workflows across the Order-to-Cash process.
Trusted by 1,000+ companies worldwide for nearly 2 decades, Zuora unifies quoting, billing, payments, AR, revenue, and analytics into the most complete monetization solution.