Week 1 – Goldilocks Rules!
It feels like consumption based business models are all anyone wants to talk about these days.
We at Zuora couldn’t be more thrilled. We’ve been supporting consumption models for our customers since day 1 and we know what a win-win it can be for everyone involved. It’s great for end customers who get to try a product with very little risk or commitment to do so. The companies selling via consumption models benefit from beautifully efficient product-led-growth (PLG). And no one ever has to worry about paying for an underutilized user seat again! Right?
But is that the whole story? Luckily, we have a lot of really great data to help us answer this question, which brings us to our insight this week.
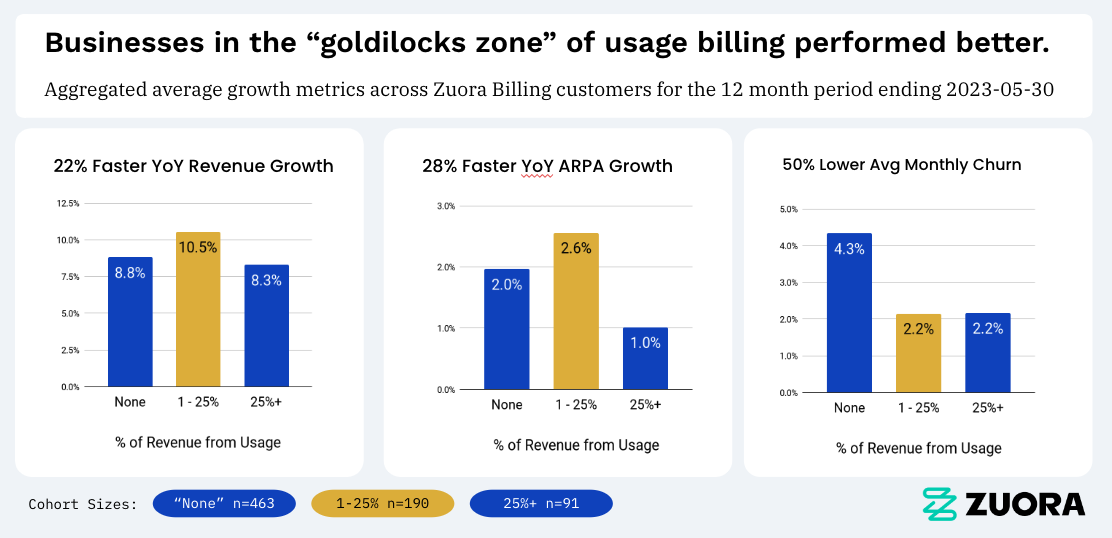
The chart above is derived from recent observations of our customer data. It anchors on the concept of usage based pricing, which is a core component of any consumption business model. Visualized are the average values for three different cohorts of Zuora customers across three common growth metrics.
The cohorts were determined by the percent of each customer’s revenue that came from usage vs. recurring charge models. As you can see, the cohort with the best performance across all three metrics are the customers who have some, but no more than, 25% of their total revenue coming from usage models.
We call these customers the “Goldilocks” cohort in reference to the children’s story. Goldilocks, so the story goes, never liked it when anything was too extreme. She couldn’t eat the porridge that was too hot or too cold, she only ate the porridge that was just right. The data above suggests that there is a “just right” level of revenue from usage models that correlates with better overall business performance.
Now, many of the fastest growing public companies leverage a usage-based model. According to Open View’s latest State of Usage-Based Pricing Report, usage-based public companies have a 38% higher forecasted YoY revenue growth than their non-usage based peers.
To some people, facts like this might appear to conflict with our findings above. If usage-based companies are growing so much faster, why then is our finding that no more than 25% of revenue from usage models correlates to the best growth metrics?
Well, the answer lies in the fact that usage based pricing is only part of the overall success of a consumption business model. Next week we’ll dig more into this and debut some brand new data insights that will help tell more of the consumption story. Stay tuned.
Week 1 methodology details
Data in this analysis covered May 2021 – May 2023.
To control for data anomalies we did two things:
- Tenants of customers who went live after May 2019 were excluded. Therefore, all tenants had at least 2 years worth of data prior to the scope of the analysis.
- Outliers beyond the 25th and 75th percentiles were excluded to further normalize the data.
Applying these criteria, the study included Zuora Billing data from 744 businesses.
Revenue amounts were determined by totalling up the amount (converted to USD) of invoice items from posted invoices during the study period.
The average value for a given cohort was derived by averaging the growth rate of each individual company’s metric.
Recurring revenue was considered any invoice item amount generated from what is called a “recurring” charge in Zuora Billing (see definition here).
Usage revenue was considered any invoice item amount generated from what is called a “usage” charge in Zuora Billing (see definition here).
Besides the 25% cohort, other cohort divisions were tested at 10%, 15% and 50%. In line with previous studies, the 25% threshold presented the most meaningful “cliff” between all the other cohorts. Therefore indicating there is still significance in this threshold.
Written by:
Jonathan Brown, Sr. Customer Strategy Director