Drive ARR growth through hybrid consumption models
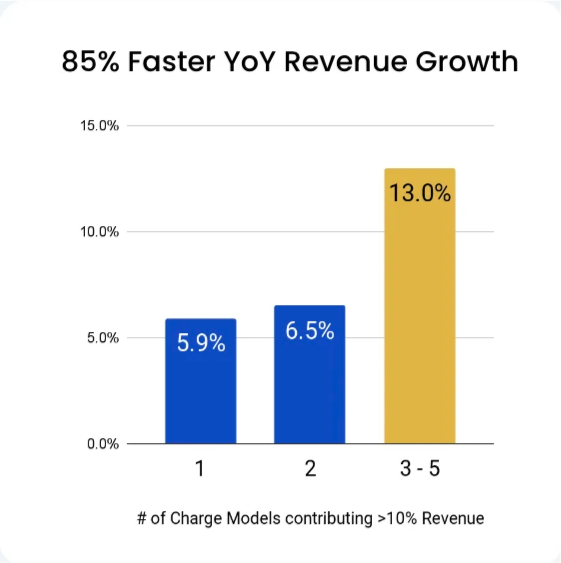
Trends around monetizing generative AI and reducing adoption barriers have many companies turning to usage, or consumption-based, pricing models to drive growth. In a recent study Zuora and BCG found that companies efficiently leveraging hybrid consumption models are growing 13% faster than their peers.
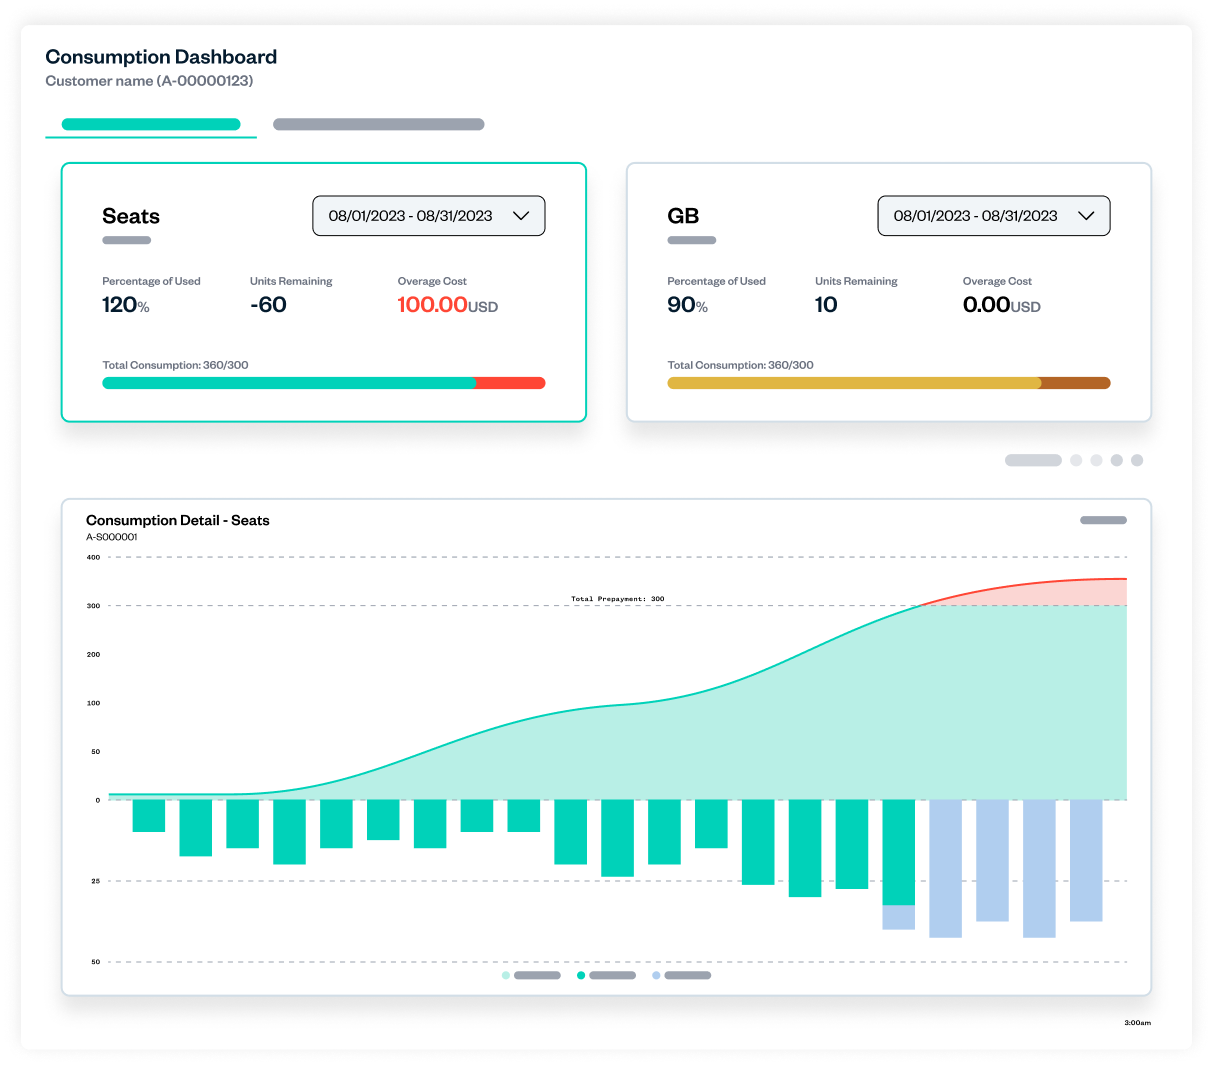
Accurately capture and bill for every bit of usage
Take the guesswork out of usage tracking
Keep your usage metering and billing in one place with detailed reporting, dashboards, and overage insights for each of your customers.
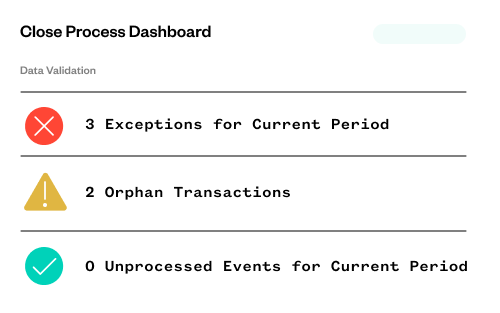
Audit usage end to end without relying on engineering
Trace back each usage event from the time it’s ingested, up until it surfaces on an invoice and revenue is recognized.
Rate usage in real time
Batch uploads of usage keep your visibility stuck in the past – as usage events flow in, rate them in real time and attach them to your customer’s account giving you precise insights into exactly how much revenue you can expect each period.
Get ahead of customer disputes
Configure real time push notifications for overages and thresholds that can go directly to your sales, CSMs, or even customers to keep them in the loop, and open the door for upsell opportunities.
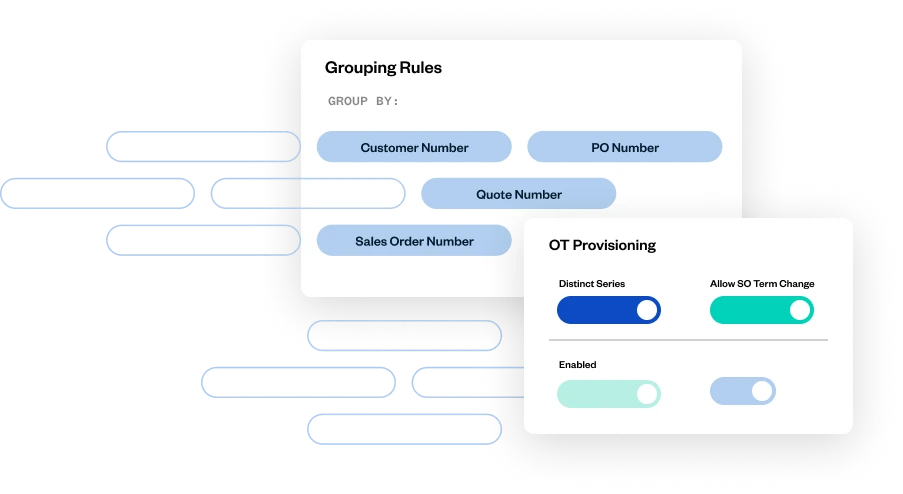
Balance flexible usage pricing, with predictable revenue
Keep up with your product teams’ innovations by mixing pricing models
Supercharge existing offers by bundling usage
Enhance your product tiers and packages with usage offerings
Lock in revenue with prepaid models
Configure pricing with prepaid cash or prepaid credits that customers draw down from over time
Encourage adoption with pay
as you go
Let new customers try out new products with little or no commitment
Keep new offers compliant with your revenue rules
Configure revenue rules for each new or existing offering to make sure it stays in line with your business’s policies
Diversifying monetization models leads to growth
With a study of over 740+ businesses, those with 3-5 different pricing models have performed the best in recent years. These companies leverage both product led growth strategies in tandem with orienting their go to market around customer adoption and building trust. This mix of strategies includes relying on consumption pricing working hand in hand with traditional committed contracts to drive revenue growth.
Remain compliant with automated revenue recognition
Maintain accurate & auditable financial reporting with usage-based models
Comply with IFRS 15 & ASC 606
Keep your accoutants out of spreadsheets, even for complex usage models like those including drawdown-style charges and unbilled usage accruals. Save accounting teams hours of work with pre-configured templates to apply variable consideration accounting, where necessary.
Minimize time reconciling accounting data
Spend less time comparing numbers across spreadsheets and multiple systems with consistent bookings, billing, and recognized revenue. Quickly identify any discrepancies with automated reports across billing and revenue data.
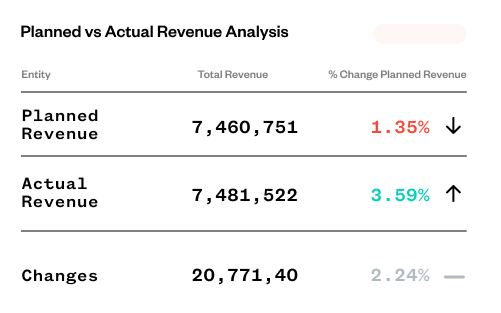
Forecast revenue based on actual usage
Meet ASC 606 guidance for forecast reporting with pre-built waterfall reports track revenue as it is recognized. Make data-driven decisions by comparing revenue actuals and forecasted revenue against each other.
Your journey starts here
As your customers change how they want to access your products and services, you have to evolve how you do business. Learn more about how our leading Subscription Economy® solutions have helped many of the world’s most innovative subscription businesses succeed.