The SEI Report: Recurring Growth Strategies for Total Monetization

Explore the data
Flexing business models to find growth in a challenging macro
In 2023, the global economy faced its fair share of hurdles, marked by increased interest rates, rising inflation, and a pervasive sense of economic uncertainty. This environment proved particularly challenging for the technology industry, which saw a continuation of layoffs and a decrease in new digital transformation initiatives.
But even in an uncertain market with increasingly stiff competition, companies in the Subscription Economy IndexTM (SEI) report found opportunities for recurring growth. By tapping into a plethora of innovative business models, these businesses have the ability to adapt and align their monetization in step with—and often in anticipation of—dynamic customer demands.
While the approach can vary widely, these businesses often share one common trait: they are committed to evolving monetization, which is how a business matches what it values with what its customers value, takes that to market, and generates revenue from it. Today, a static model, such as a traditional subscription with a set monthly fee, is often no longer enough to maintain a competitive edge.
For many, this “Total Monetization” strategy means moving beyond traditional subscriptions and exploring a mix of models to align monetization with demand and fuel more sustainable, recurring growth. Examples of this include experimenting with consumption pricing or creatively bundling and unbundling offers.
The winners in this evolving landscape will be those that not only navigate the immediate challenges of the economic environment and increasing competition, but also understand and anticipate customer demands. This future-focused approach will enable companies to lay the groundwork for sustainable recurring growth through customer-centric strategies and adaptable business models.
The SEI report analyzes the growth and resilience of businesses leveraging various monetization models designed to provide recurring growth. Comprised of anonymized, aggregated, system-generated activity on the Zuora Billing service, the SEI measures the change in the volume of business for more than 600 companies.
Key Findings
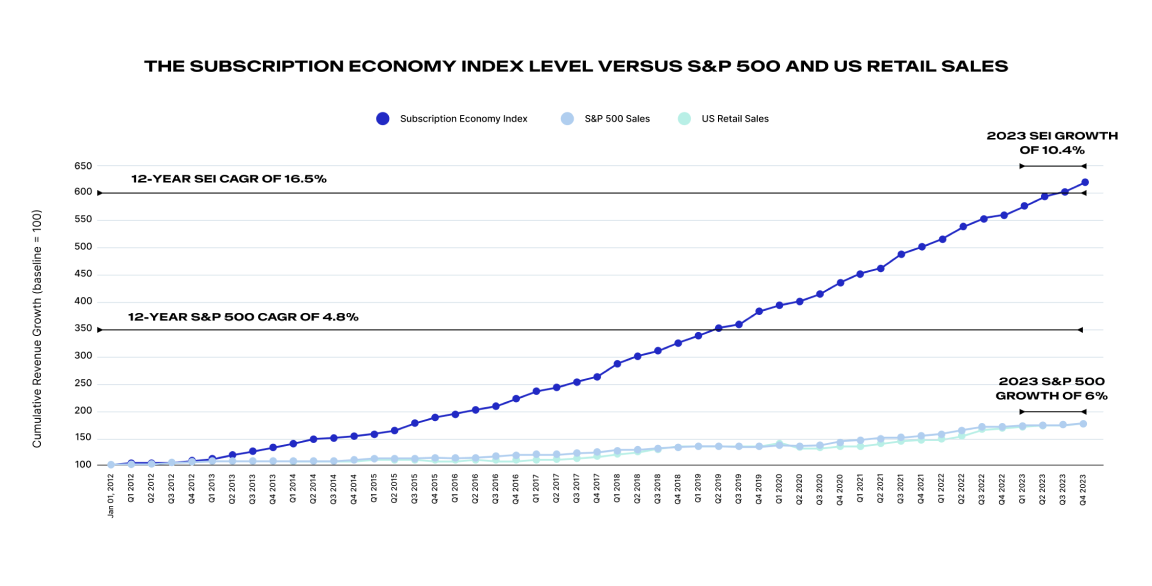
- Despite global macroeconomic conditions and increasing competition, companies in the SEI continue to outpace the S&P 500 (Table 1)
About This Report
The latest edition of the annual Subscription Economy Index™(SEI) analyzes the growth and resilience of businesses leveraging various monetization models designed to create recurring growth. This edition of the SEI (as of April 2024) features new data from the last 12 months, ending December 31, 2023.
What the report uncovers:
- Outpacing the Market: Discover how SEI companies surpassed macroeconomic challenges, outperforming the S&P 500 in 2023.
- Customer Dynamics: Uncover the resilience in customer retention and gain insights into the trajectory of annual revenue per account.
- Sector-Specific Trends: Explore insights on SaaS, Media, and Manufacturing.
Over the past 12 years, companies in the SEI have grown 3.4x faster than the companies in the S&P 500, which have historically represented more traditional, product-based businesses. Specifically, the compound annual growth rate (CAGR) for SEI companies was 16.5%, compared to 4.8% for the S&P 500 over the same period (Table 1).
Despite various macroeconomic headwinds, companies in the SEI continued to outpace S&P 500 companies in 2023, with 10.4% revenue growth compared to 6%, respectively (Table 1).
- SEI quarterly revenue growth held steady over the past year, while the S&P 500 continues to decline (Table 2)
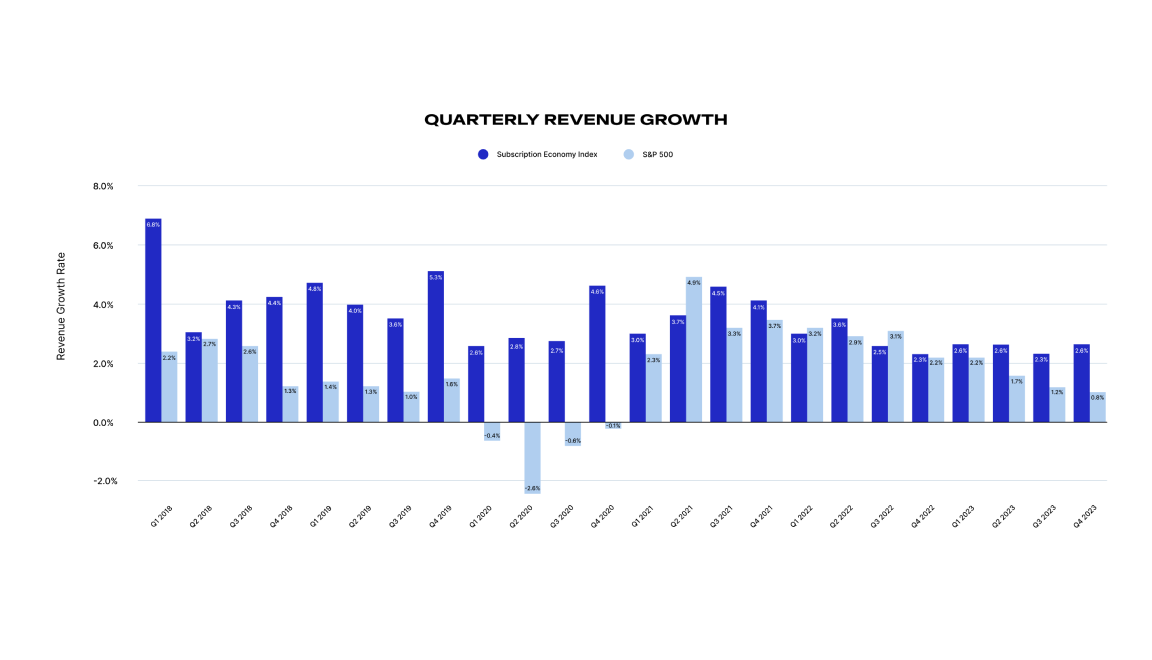
A five-year analysis of quarterly revenue growth demonstrates that, while both the SEI and S&P 500 experienced an initial dip in response to the pandemic, the decline for the S&P was more severe. Both indices experienced surges following this dip due in part to pent-up demand and stimulus money, but the ensuing years have seen the two part ways with respect to growth trends. While the SEI appears to have returned to and is holding steady at pre-pandemic levels, the S&P 500 has been in a steady downward trend since its peak in Q2 2021.
Though multiple variables are likely at play, factors like rising inflation and market saturation may be causing consumers to be more mindful of their spending and diligent in managing their services. Agile strategies and technologies that are both customer-centric and future-proof can also help encourage continued growth.
Multiple quarters of outperforming growth could indicate that the companies in the SEI are executing on this better than companies in the S&P 500.
Businesses should invest in strategies and technologies that help surface rich customer insights into behavior and preferences to quickly adjust product development and go-to-market initiatives that can deliver maximum value back to customers.
As businesses continue to fight over pieces of the same pie, it’s more imperative than ever to focus on customer centricity and future proofing to foster loyalty and fuel recurring revenue.
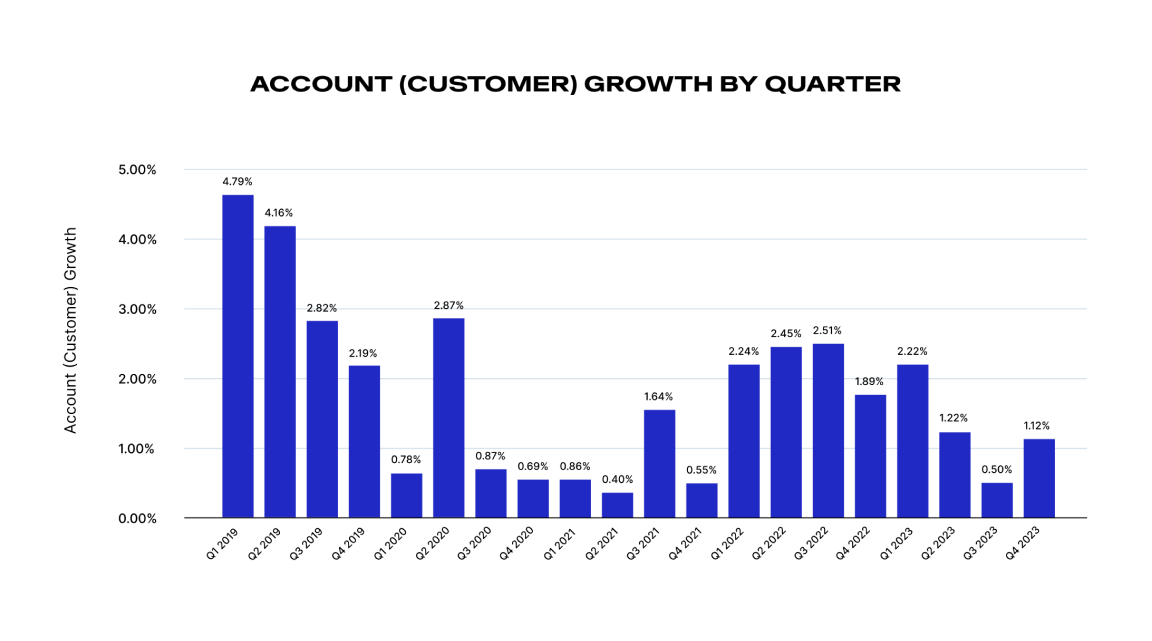
- In the face of economic headwinds, SEI customer acquisition slowed in 2023 (Table 3)
Recurring revenue business models have historically provided stability during turbulent times. Since the focus of such business models is often on nurturing and monetizing relationships rather than repeating multiple one-time transactions, they are inherently resilient. These business models have a unique advantage in that they offer three potential levers for growth: acquiring new customers, retaining existing ones, and expanding revenue through upselling or cross-selling.
Key findings 3, 4, and 5 examine the various ways that companies in the SEI can achieve recurring growth—through new customer acquisition (account growth), customer retention (inverse of churn), and expansion (annual revenue per account).
Customer acquisitions within the SEI did slow in 2023 (Table 3), this validates what is being seen on a macroeconomic level.

- Companies are retaining their customers: Churn rates in 2023 dipped lower than the previous three years (Table 4)
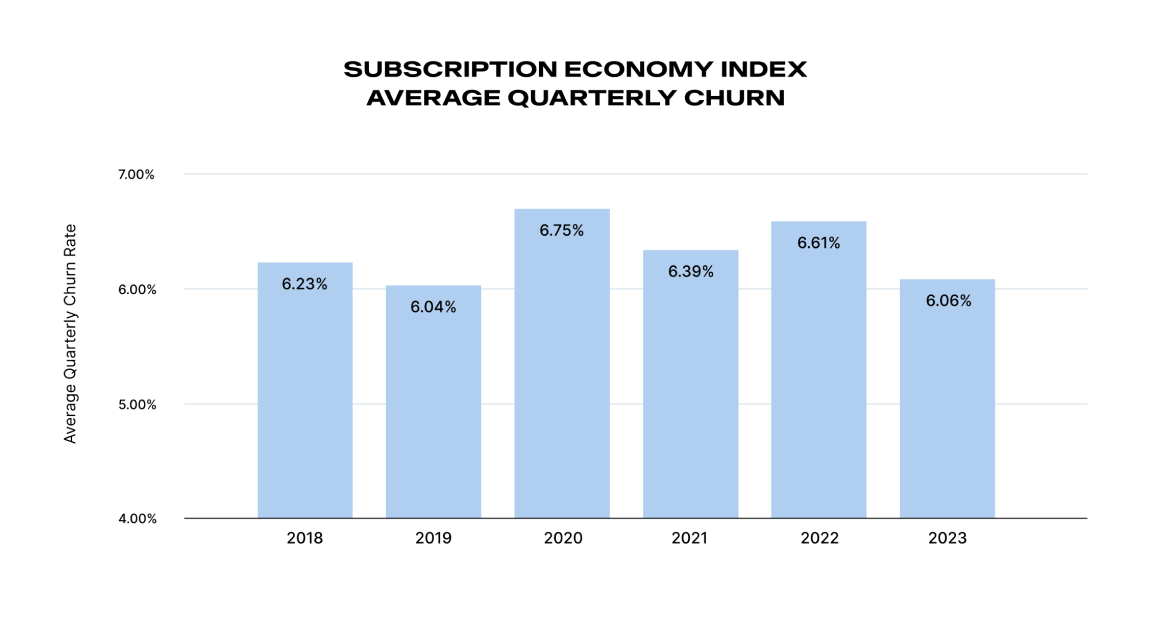

While account growth slowed in 2023 (Table 3), companies in the SEI also experienced lower churn (Table 4). Counter to suggestions of a “great unsubscribe,” companies in the SEI saw an improvement in customer retention, with churn numbers falling below pandemic and even pre-pandemic levels (Table 4).
Continuously delivering on value is a key factor to retention. While consumers still find great value in their subscription services and they are likely to keep the ones they have, they often churn when they are not receiving the expected value.
Companies can better retain customers by focusing on customer value. This often means providing beyond the original service or product a customer signed up for. Examples of this include more flexible pricing or billing options to customers, who are also feeling the strain of slashed budgets. Companies can improve retention by finding ways to provide their customers with alternatives to churning, such as pausing, changing tiers, changing to monthly billing, or moving from a subscription plan to pay-as-you-go.
- Customer expansion, or annual revenue per account (ARPA), improved, and remains on an upward trend (Table 5)
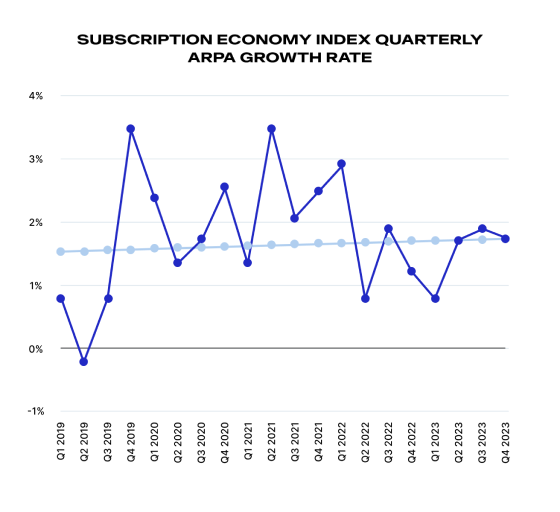
Annual revenue per account (ARPA) experienced a slight upward trend over the last 20 quarters, with an encouraging YoY turn in 2023. Starting with a quarterly growth rate of 0.73% in Q1 2023, ARPA growth ended the year more than 2x stronger at 1.76% in Q4. Given 2023’s quarterly average of 1.5%, growth represented an improvement from the average of 1.29% in 2022.
Global economic challenges likely contributed to slower account growth in recent years, however, adversity and competition fuel innovation and new ways of doing business. When growth is harder to come by, the companies that achieve best-in-class growth do so by investing heavily in customer retention.
And because it costs more to acquire than retain customers, growth during challenging times can be achieved by adapting monetization models aimed at nurturing and growing existing customers. By focusing on upselling, cross-selling, and renewals, these companies can fuel more sustainable annual recurring revenue (ARR) growth and ARPA growth.
SaaS
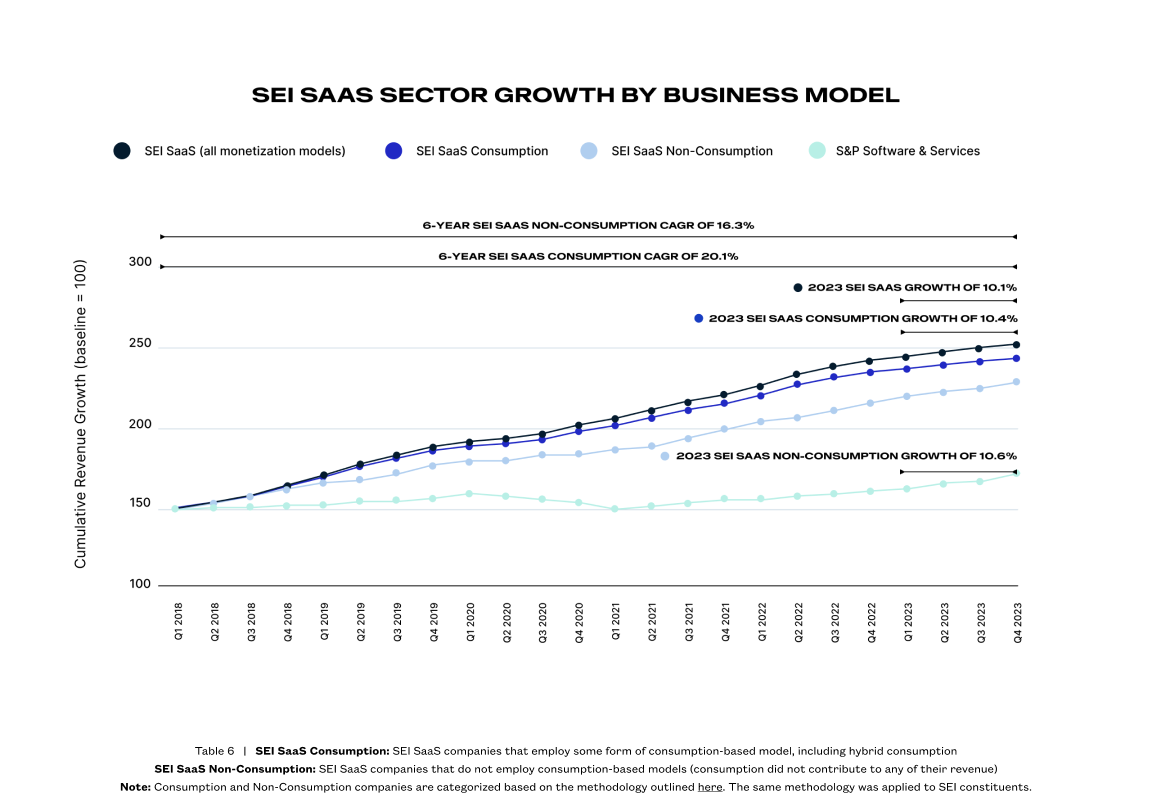
In 2023, the SEI SaaS sector overall experienced a 10.1% revenue growth rate on average (Table 6). Within this sector, SEI SaaS companies employing consumption-based models experienced a cumulative revenue growth (CRG) rate of 10.4%, higher than the SaaS sector as a whole, but slightly slower growth than the subset of SEI SaaS companies using non-consumption models, which grew at 10.6%.
Recently, hybrid consumption models that combine predictable subscription approaches with more variable usage models have stepped to the forefront as drivers of recurring revenue. Although the SaaS sector is still fine tuning these pricing and packaging strategies, the results are promising when comparing the current performance of hybrid consumption with non-consumption and all other SaaS monetization models in the SEI (Table 6).
It’s important to note that businesses with consumption-based models are maintaining a long-term revenue growth advantage. At the end of 2023, the 6-year CAGR for SEI SaaS companies employing consumption-based models was 20.1% compared to 16.3% for the non-consumption counterparts.
This long-term trend aligns with previous Subscribed Institute research on consumption models. While pure usage revenue can be less predictable and more volatile, hybrid consumption models can be a good fit for SaaS offerings—particularly cloud services and generative AI. This evolution of generative AI monetization signals a broader trend among companies exploring how to effectively price their AI offerings. These hybrid, agile models can help provide predictability, while also improving value to the customer by tying pricing and payments more directly to usage and actual demand.
SEI SaaS YoY Change in Growth Rate (2022-2023)
While overall the SEI SaaS sector continues to grow, year-over-year, the growth was slower in 2023 compared to 2022. SEI SaaS sector revenue growth fell at a rate of -1.3%, and YoY ARPA growth is down at a rate of -0.61%. However, YoY churn is also down at a rate of -0.6%, meaning customers are keeping their SaaS services.
Data in the SEI corroborates reports of a challenging environment marked by increased competition and market saturation. There has been a notable effort on the part of CIOs to consolidate products and services across the wider SaaS industry, which can lead IT departments to trim their vendor count instead of buying new.
That said, there are silver linings and learnings to be gleaned from these trends. First, the sector continues to grow, albeit at a slightly slower rate than the previous year.
Also, the reduction in churn, particularly for SaaS, indicates that companies in the SEI are effectively managing the pressures of a challenging market environment.
Resiliency, innovation, and adaptability are the strategies of the day. Elements of the SaaS business model lend itself to these strategies. Resilience can be found in maintaining and growing relationships with existing customers. Innovation is being driven by strategies such as modularity and new packaging for lighter lands, improved product and services offerings that increase stickiness, as well as new categories of products or services, like generative AI, that are presenting opportunities to rethink monetization models and strategies.
Media & Entertainment
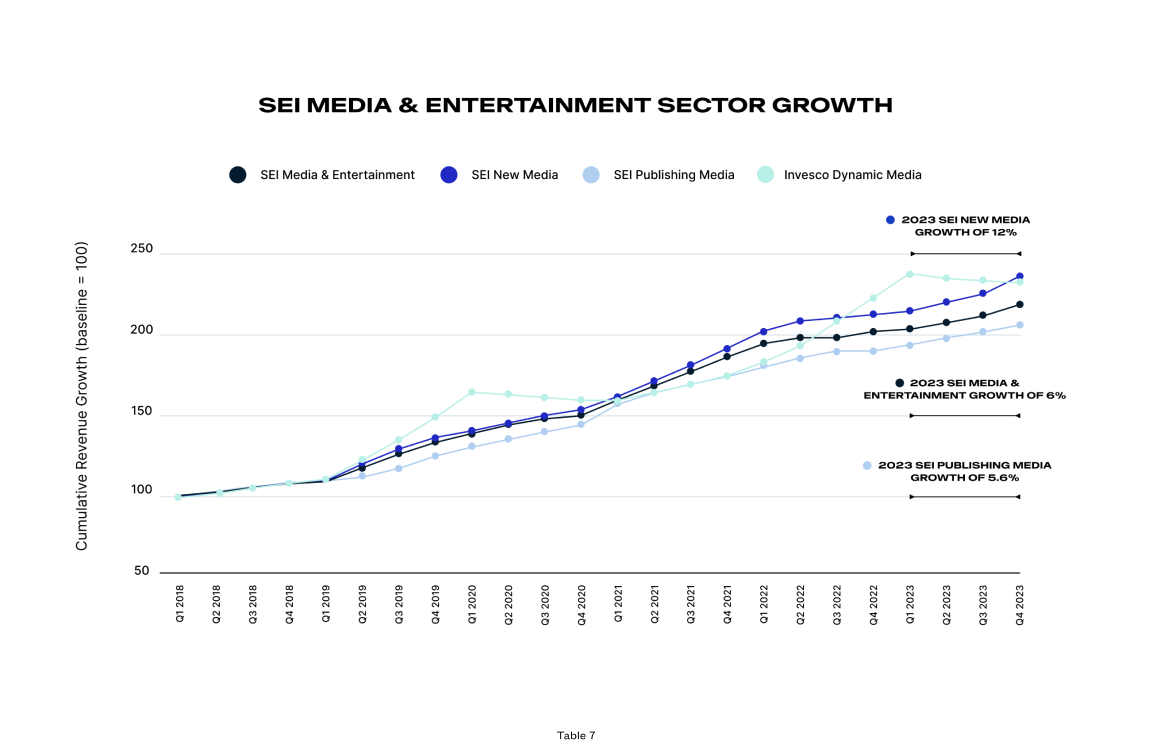
In 2023, companies in Media & Entertainment experienced a pivotal evolution, navigating a mixture of market-rocking challenges while seizing growth opportunities. The SEI Media & Entertainment sector observed a revenue growth rate of 6% on average in 2023, highlighting the resilience and adaptability of media companies in a fluctuating market landscape (Table 7).
The growth was unevenly distributed, with the SEI New Media subset (examples of which include streaming and gaming companies) leading at an impressive 12% revenue growth rate on average, spotlighting an ongoing shift toward digital and streaming services. Conversely, the SEI Publishing
Media subset (examples of which include traditional and digital newspapers and magazines) grew by a more modest rate of 5.6%, the slowest within the sector, which reflects the ongoing struggle and gradual adaptation of traditional publishing to the digital-first consumer preferences.
This juxtaposition of growth rates underlines diverse trajectories within the media landscape, where New Media ventures thrive on innovation and adaptability, while Publishing Media works to reinvent and stabilize in a rapidly evolving environment.
SEI Publishing Media YoY Change in Growth Rate (2022-2023)
SEI New Media YoY Change in Growth Rate (2022-2023)
Churn rates provided nuanced insights, indicating a dichotomy within the sector: SEI New Media successfully reduced churn by 1.3% YoY, showcasing effective customer retention strategies, such as crackdowns on password sharing across the industry, aimed at converting shared users into paying subscribers. On the other hand, SEI Publishing Media faced a slight increase in churn (0.02%), which could signal challenges in maintaining subscriber engagement amidst a fiercely competitive environment.
ARPA growth varied across the sector. The SEI Publishing Media segment saw a modest increase of 0.75%, benefitting from strategies like strategic bundling and enhanced content offerings, which helped The New York Times surpass 10 million subscribers. New Media, however, faced a 1.7% decline in ARPA, highlighting the challenges of pricing strategies and market saturation pressures. This calls for innovative approaches to value creation and subscriber revenue maximization.
Manufacturing
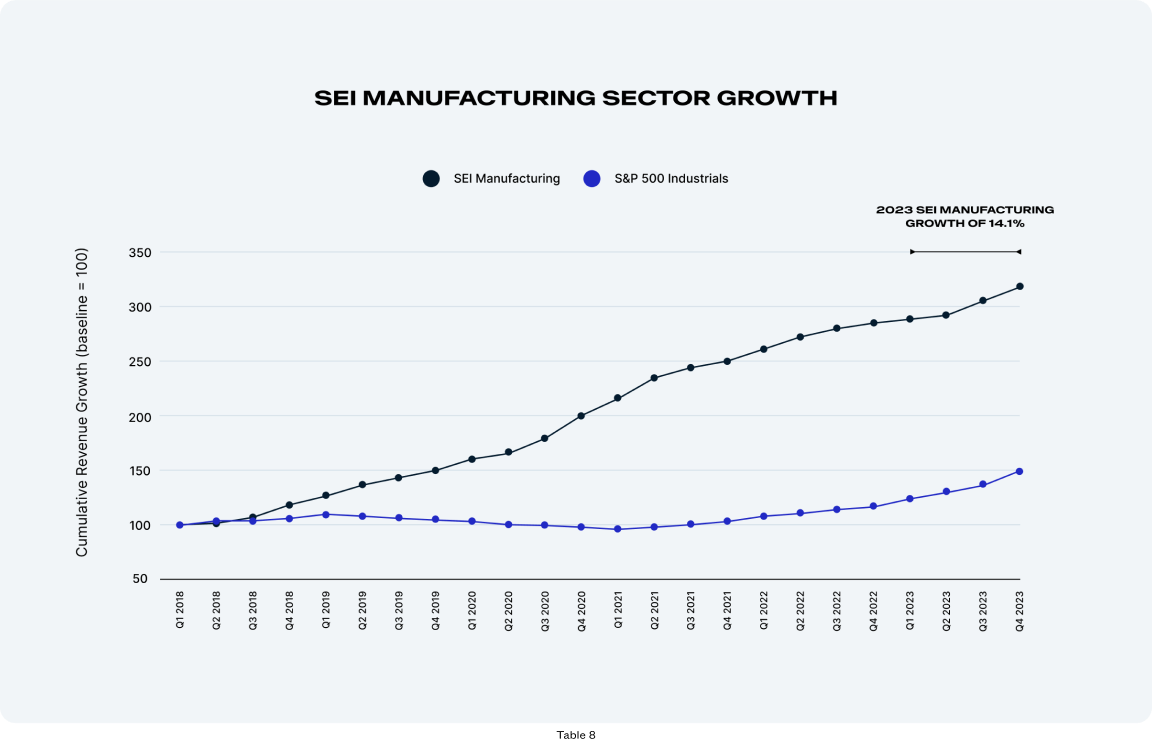
SEI Manufacturing YoY Change in Growth Rate (2022-2023)
State of SEI by World Region
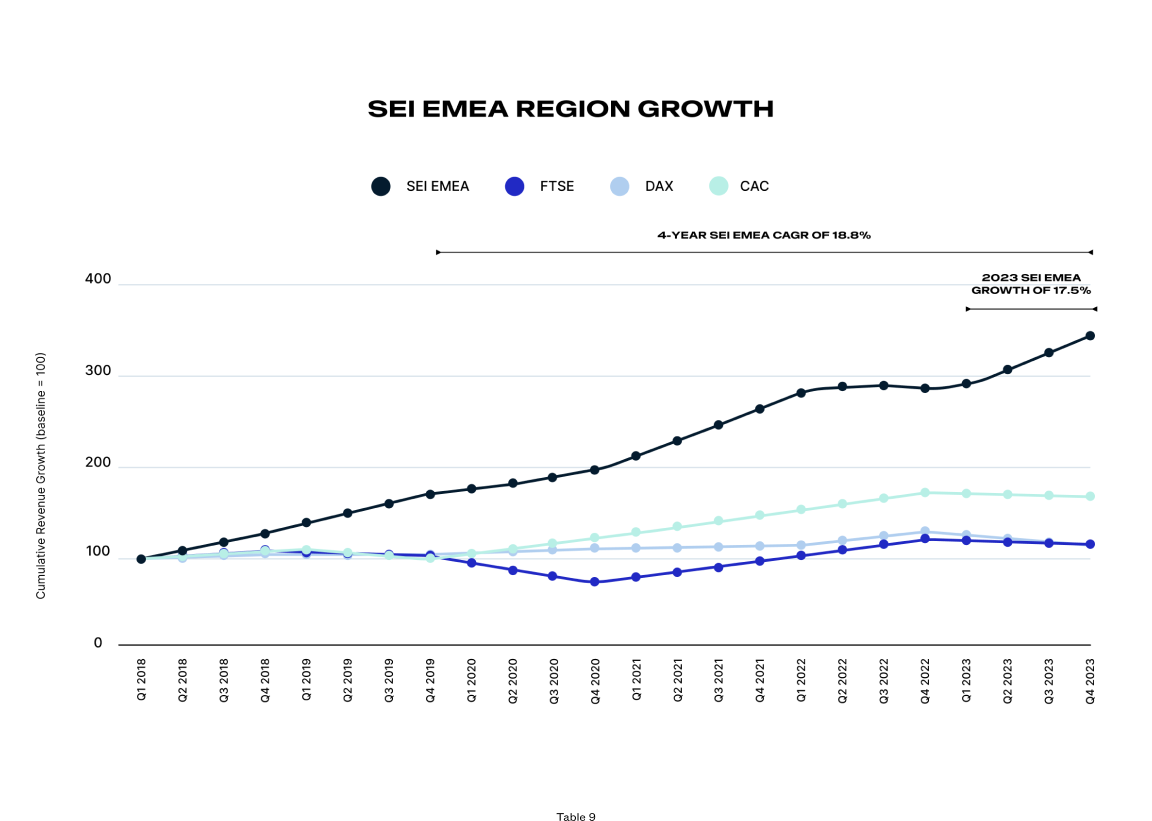
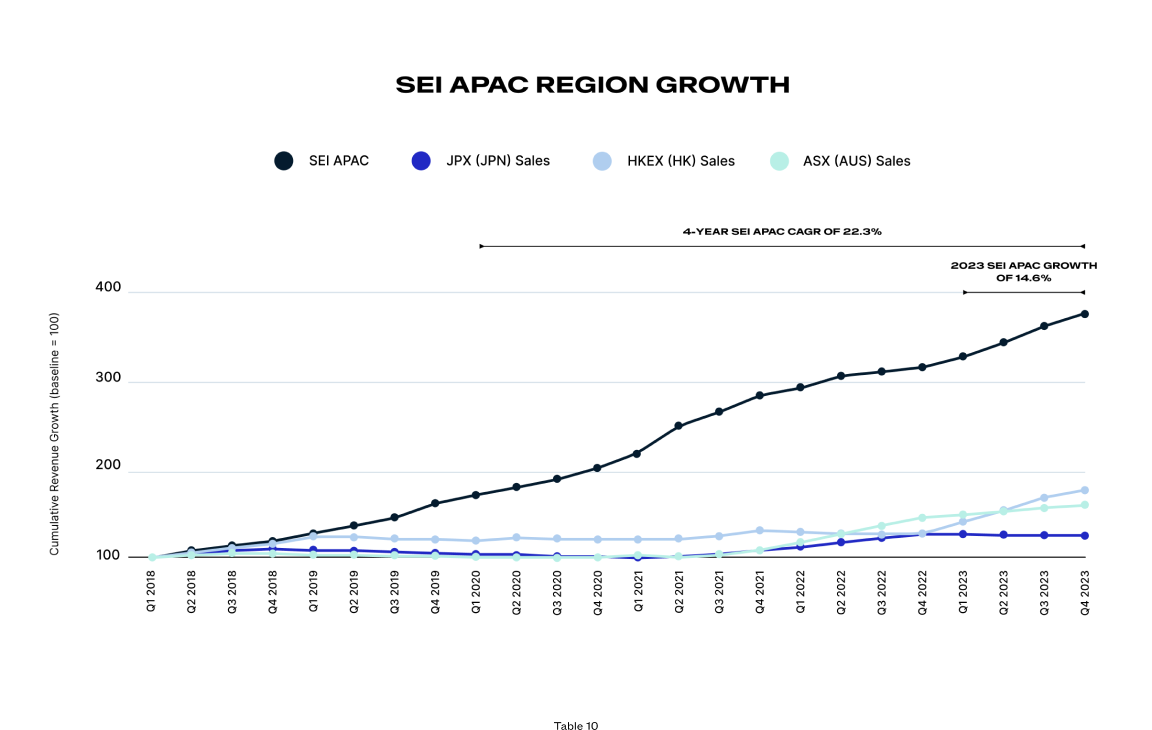
Businesses in the SEI continue to thrive in EMEA and APAC compared to regional stock indices
In 2023, revenue for SEI companies in EMEA demonstrated significant growth when compared with the FTSE, CAC, and DAX indices. Revenue growth rates in APAC showed similar strength against the JPX, HKEX, and ASX indices. SEI businesses in EMEA experienced a revenue growth rate of 17.5% on average for 2023 and a
4-year CAGR of 18.8% (2020-2023) (Table 9).
Meanwhile, SEI businesses in APAC experienced revenue growth of 14.6% on average for 2023 and a 4-year CAGR of 22.3% (2020‑2023) (Table 10).
SEI Sectors
The Software as a Service (SaaS) Index includes providers whose software is accessed via the cloud, and monetized via subscriptions, including traditionally perpetual software shifting to SaaS. This includes SMB SaaS, B2Every SaaS, and Enterprise SaaS companies.
The Media & Entertainment Index:
- SEI New Media Subset: Includes sports, streaming and OTT platforms, fan engagement, telecommunications, operators, smart venues, advertising, music, radio, live venues, and gaming
- SEI Publishing Media Subset: Includes traditional publishing channels, such as newspapers, magazines, books, or digital channels (desktop, apps) distributed to mass or segmented audiences
The Manufacturing Index includes fabrication services, industry-specific software providers, industrial design, IoT, heavy equipment, and tool manufacturers.
Terminology
Compound Annual Growth Rate (CAGR):


Account Churn Rate:
Average Revenue Per Account (ARPA) Growth:
Forward-Looking Statements
This report contains forward-looking statements that involve a number of risks, uncertainties, and assumptions, including but not limited to statements regarding the expected growth and trends of recurring revenue-based companies, such as subscriptions (including companies in the SEI report) and non-recurring revenue based companies. Any statements that are not statements of historical fact may be deemed to be forward-looking statements, and actual results could differ materially from those stated or implied in forward-looking statements.
This report also includes market data and certain other statistical information and estimates from industry analysts and/or market research firms. Zuora believes these third party reports to be reputable, but has not independently verified the underlying data sources, methodologies, or assumptions. Information that is based on estimates, forecasts, projections, market research, or similar methodologies is inherently subject to uncertainties and may differ materially from actual events or circumstances.