The Ultimate Guide to Churn for Subscription Businesses | Zuora
Acquiring new customers is crucial for any business. But retaining those customers can be even more valuable. However, knowing if your retention strategy is effective can be challenging if you don’t understand why customers seem to disappear just as quickly as they signed up.
The reality is that churn is a real problem for businesses, and it’s important to understand the percentage of subscribers leaving and why.
Churn can provide valuable insights into how to retain subscribers. The benchmark for subscription churn rate was 6.4% in 2022, according to the Subscription Economy Index.
If subscription businesses can’t keep customers on board, they’ll struggle to hit revenue goals and maintain the growth needed. From here on out, we’ll focus on voluntary churn, the deliberate choice to end a business relationship, and discuss effective strategies for reducing it.
However, it’s also worth mentioning involuntary churn, which occurs when a customer accidentally ends a business relationship, usually due to a payment failure or IT error. This is often an easy fix when the customer wants to stay on board.
Let’s dive in.
How to conduct a churn analysis
Which churn metrics should you use?
Conduct assessments on the impact of churn on your business
How to reduce churn in your subscription business
Revamp your onboarding process
Segment your most at-risk and valuable customers
Prioritize your existing relationships
Refine your subscription cancellation email & exit process
Minimize subscription churn with data-driven processes
Equip your support and sales team with the best training and resources
Invest in a customer success team
What’s considered a “good” (or acceptable) churn rate?
Is 5% an acceptable monthly churn rate?
Customer lifetime value and churn rate
What is the benchmark for subscription churn rate?
How often should I calculate my churn
What is a churn rate?
Your churn rate, also known as customer attrition, is the percentage of customers who subscribe to your business or service and subsequently discontinue from doing business with you over a given period of time, such as monthly or annually.
Churn rate impacts the business bottom line and is a vital metric that offers insight into your subscription business’s performance, providing a foundational assessment of customer retention and revenue. Every company experiences some churn across the calendar year, but consistently high churn rates are a big red flag.
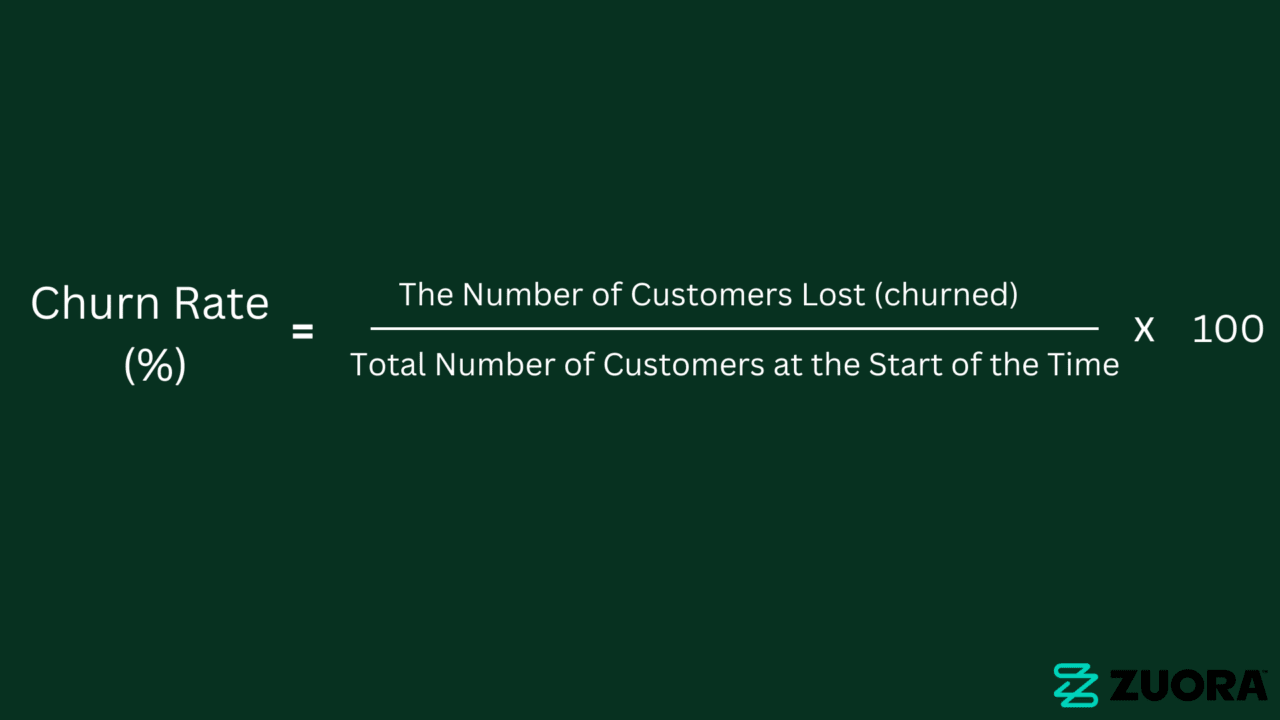
Churn rate formula
To calculate your churn rate, use this churn rate formula: (number of customers lost ÷ total number of customers at the start of the time period) × 100.
For example, suppose you begin a certain month with 350 customers, and over the course of that month, you lose 50 customers due to cancellation, ineffective customer support, card payment decline, or poor onboarding.
Your business churn rate for that month will be (50 ÷ 350) × 100, and the answer is: 14%.
Types of churn to measure
The following are the different types of churn in SaaS and subscription based industries:
- Customer churn
- Revenue churn
- Gross MRR churn
- Net churn
Customer churn
Customer churn measures how many customers cancel their subscriptions in a given time period, independent of how much revenue you’re earning from them. This metric is comparable to your retention rate metric, which is simply a different way to express your churn calculation.
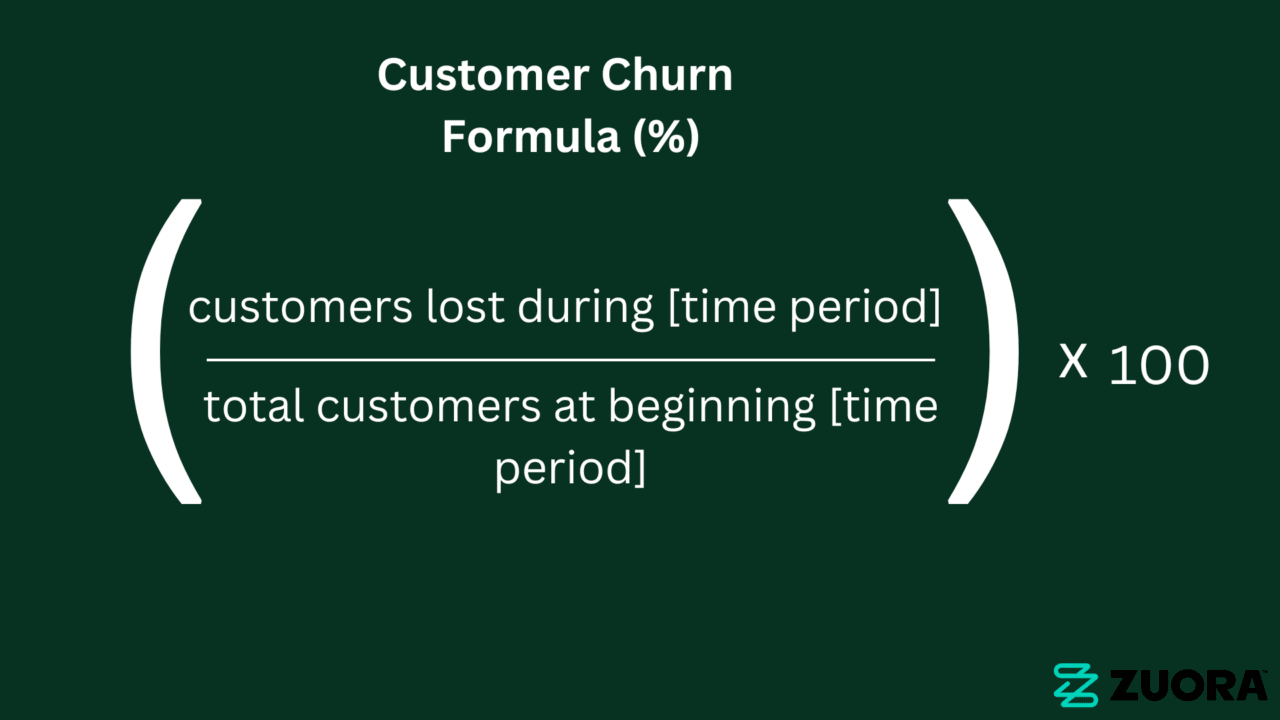
If you want to calculate customer churn for all of 2022, for example, use this formula: [100 (customers lost in 2022) ÷ 2,500 (total customers at beginning of 2022)] × 100
Customer churn rate = 4%
(Note that customer churn measures the number of customers up for renewal who decide to continue service, not new customers gained in that time period.)
Revenue churn
Revenue churn measures whether a given cohort of recurring revenue is retained over a given time period. It’s not customer-specific, but it provides important context for other calculations such as net revenue churn, which addresses upsell revenue, as well as other pricing strategy considerations.
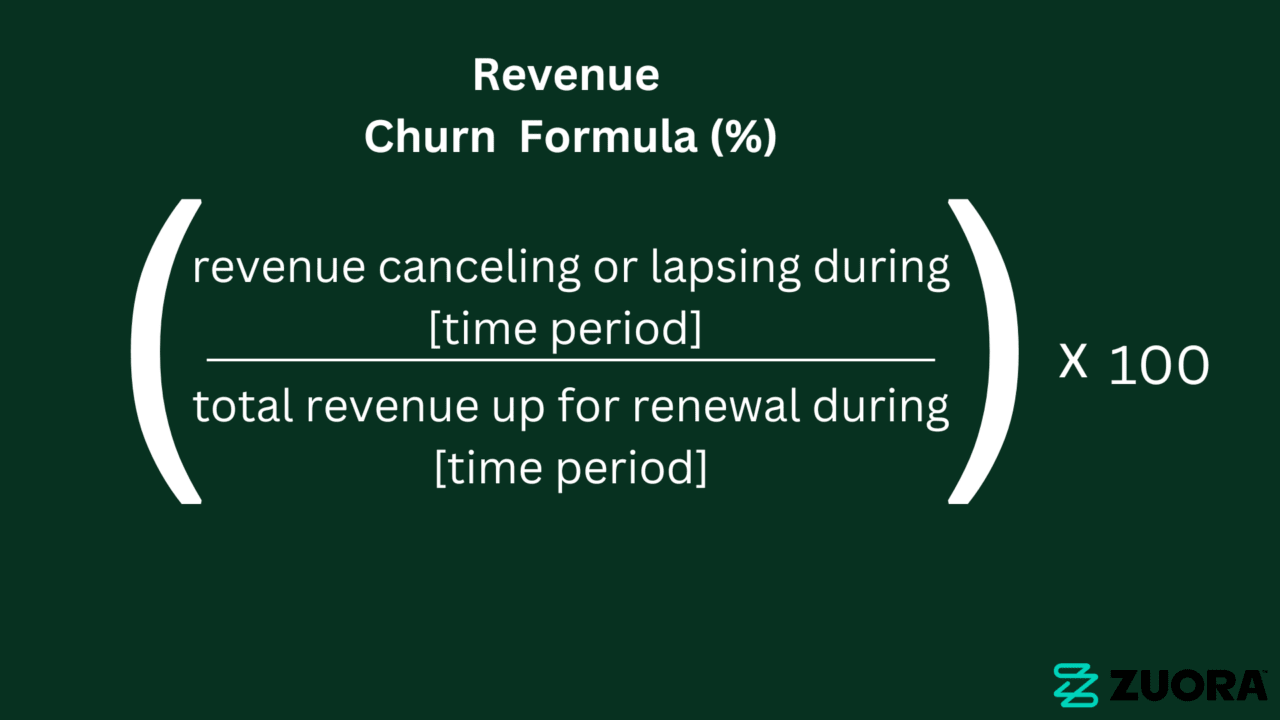
Revenue churn rate = (revenue canceling or lapsing during [time period] ÷ total revenue up for renewal during [time period]) × 100
For example: if you wanted to calculate your revenue churn rate for the month of January, here’s how it might look: $5,000 (total revenue lapsing in January) ÷ $75,000 (total available revenue for renewal) × 100
Revenue churn rate = 6.6%
Gross MRR churn
Gross MRR churn refers to the percentage of total revenue lost due to cancellations or downgrades.
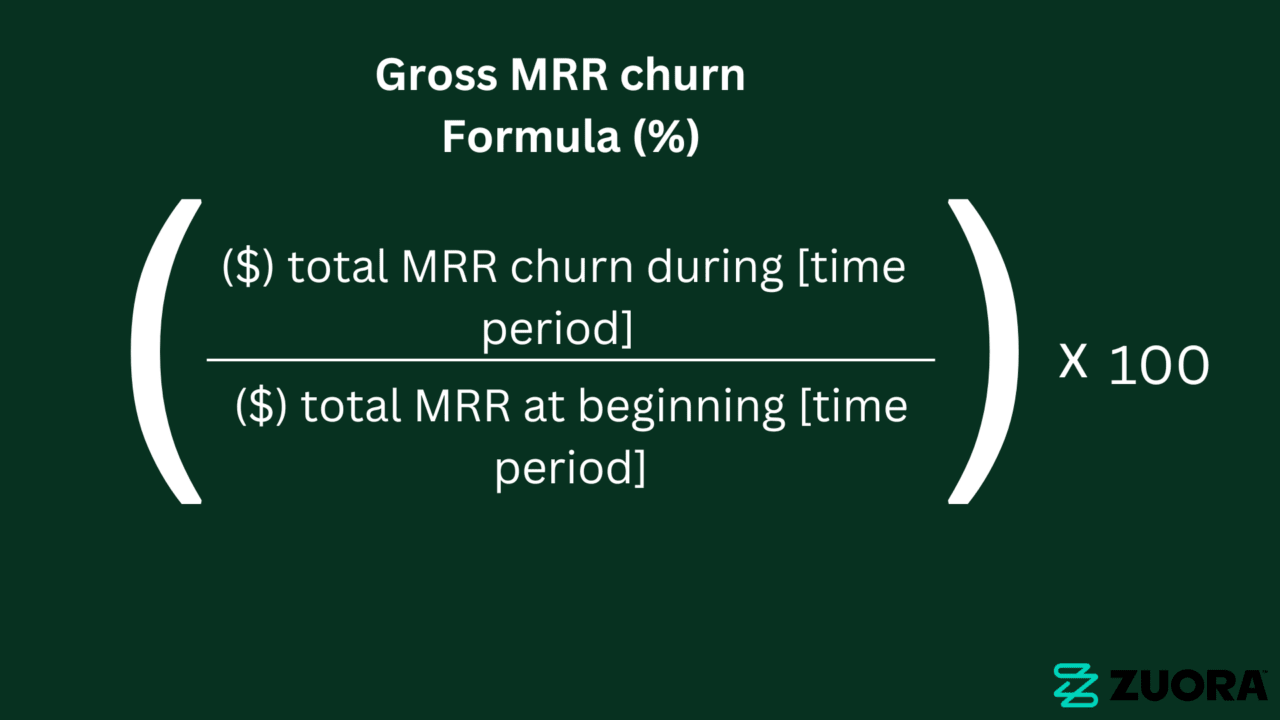
For example, let’s say your company lost $10,000 due to users canceling, and your total MRR at the beginning of the month is $100,000.
Your gross churn rate = (revenue canceling ÷ total revenue at the beginning of that month) × 100
Gross churn rate = (10,000 ÷ 100,000) × 100% = 10%.
So your gross MRR for the month is 10%.
Net MRR churn
Net churn refers to the percentage of revenue lost due to cancellations and downgrades after factoring in expansions and upgrades.
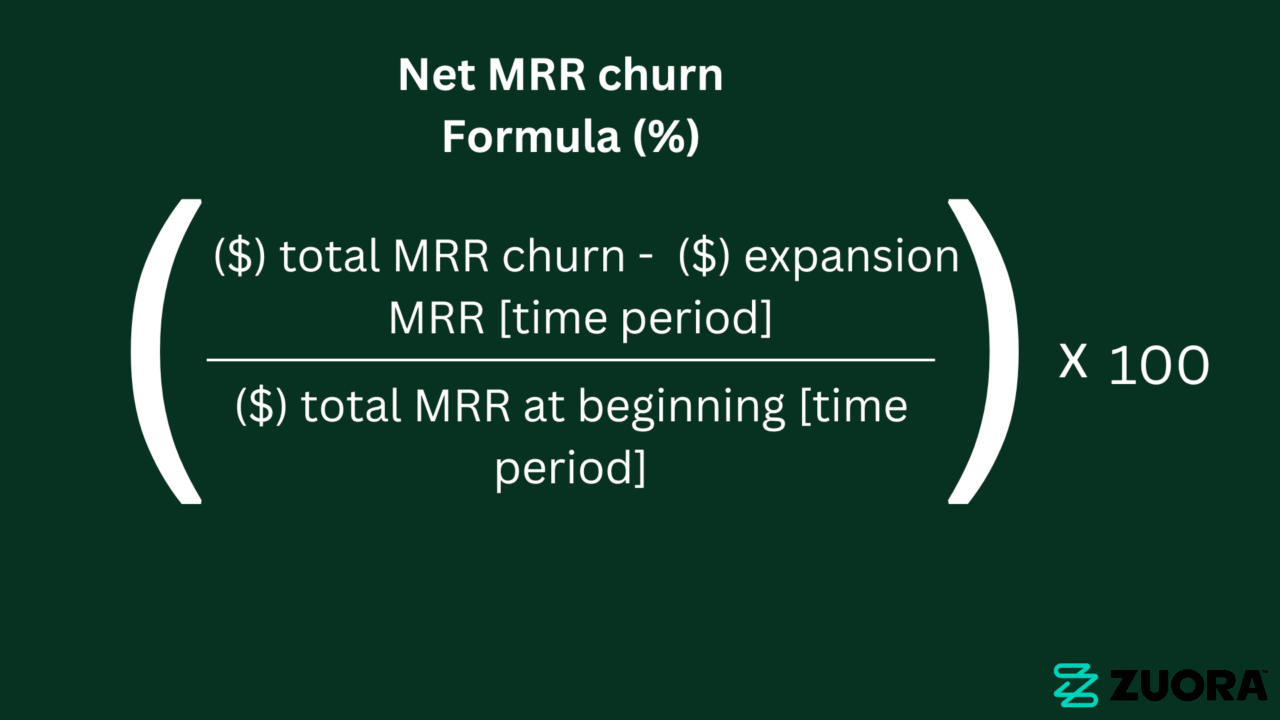
For example, let’s say your company lost $10,000 in MRR due to churn this month, but due to expansion or upsell you gained $5000 in MRR from upsells or expansions during the same period, and your total MRR at the start of the month was $500,000:
Net MRR rate = ([total MRR lost – expansion MRR] ÷ total MRR at the beginning of that month) × 100
Net MRR churn rate = (($10,000 – $5000) ÷ $50,000) × 100 = 10%
So your net MRR churn rate for the month is 10%.
Related: How to minimize involuntary churn
Factors affecting churn rate
The following five factors have been found to impact a company’s churn rate:
- Industry type
- Average revenue per user (ARPU)
- Contract length
- Company age
- Company size
Industry type
Across industries, the average churn rate varies.
Each industry has its own unique set of circumstances. Studies have shown that the telecom industry churn rate can be between 20% – 40% annually, which is a bit higher than the SaaS industry.
This is expected as customer behavior, competition, and the nature of the product or service vary. For example, B2B buyers are often stable, steady, and have a long buying cycle, unlike B2C where buyers are often more impulsive and spontaneous.
Company age
Older companies tend to have much lower churn rates than new companies in the same industry, as older companies have matured and passed the survivor’s bias stage. As a company ages, it better understands its customers’ needs, gains more loyal customers, and reduces the churn rate.
Unlike older companies, new companies have yet to figure out their product-market fit and might not have built a strong customer base.
Average revenue per user (ARPU)
Pricing can impact a company’s churn rate. Companies with higher ARPU tend to have lower churn rates, as customers tend to stick with companies that provide them with higher value.
The higher the monthly ARPU generated, the more your business generates revenue and experiences growth. Typically, higher ARPU leads to net negative churn.
For example, a SaaS company that offers its service for $500 per month per user will likely experience a lower churn rate than a company that charges $50 per month per user.
Related: How to accelerate iteration on pricing, bundles, and promotions
Contract length
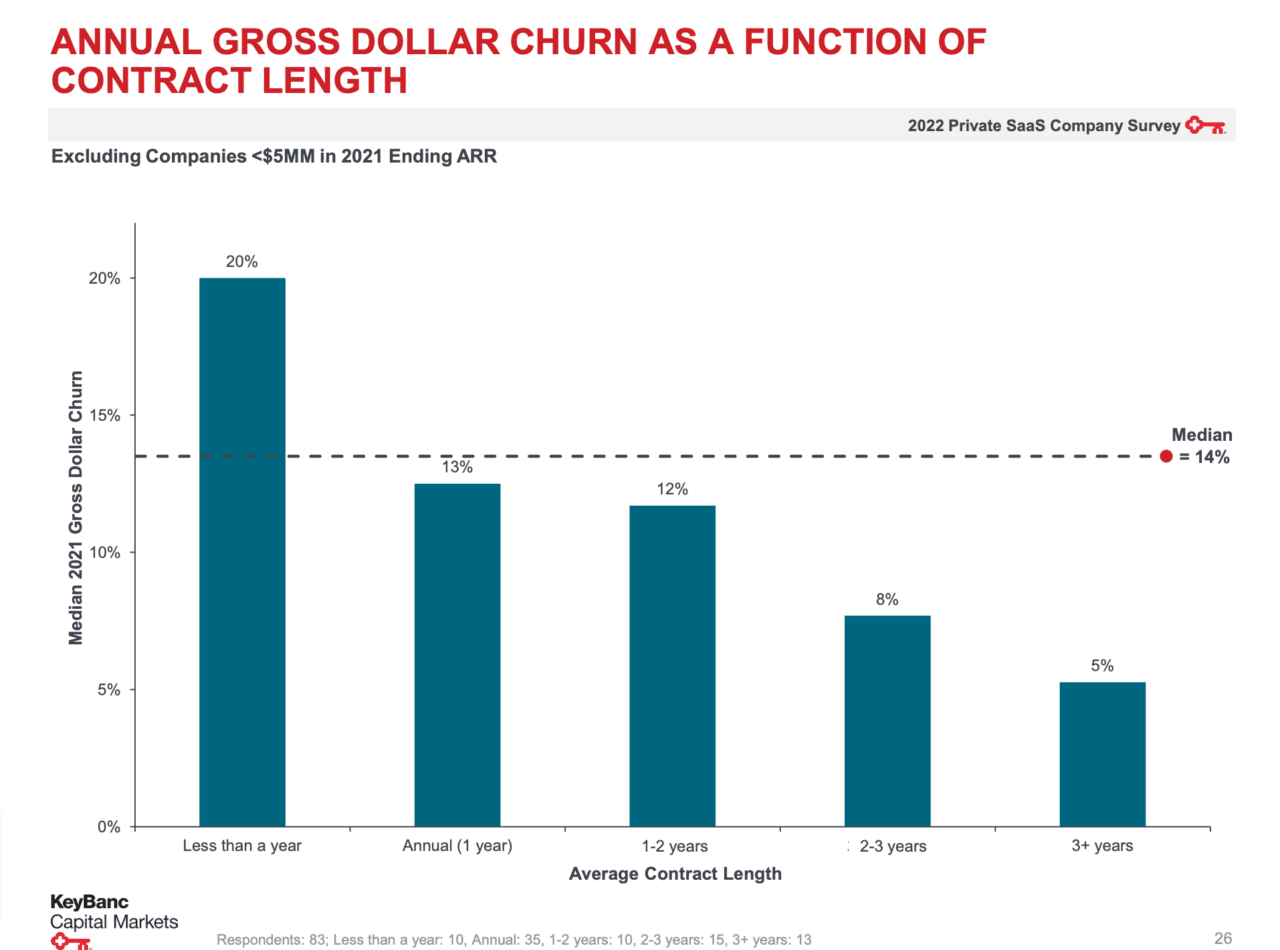
Like dating, the longer you commit, the less likely you want to break up—similarly, the longer the contract, the less likely the churn.
Annual contract customers have less opportunity to churn compared to monthly customers. With an annual contract, you really only have one opportunity each year to churn, compared with monthly customers that have 12 opportunities in a year.
Enterprise annual contract customers typically have higher average contract value (ACV) and are committed and invested in getting a win from a particular product or service.
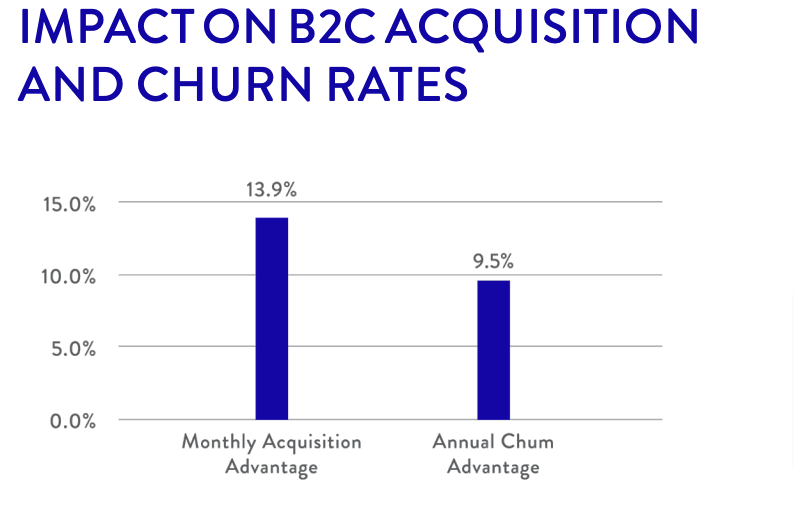
As seen from our study above, while the average acquisition rate for monthly plans is 13.9% higher than annual plans, the churn rate for annual plans is 9.5% lower.
Annual contracts also provide businesses with predictable revenue to better plan their resources.
Company size
A company’s size can also impact its churn rate. Smaller companies that have less revenue can see higher churn rates because a churned customer accounts for a greater percentage of your total revenue.
Company size may also be related to company age, with smaller companies like startups or other new companies not having a stable customer base or still working on product-market fit as mentioned above.
This differs from larger companies that have more enterprise deals with longer buying cycles and a more involved evaluation process, which makes customers more invested in the purchase they’ve made.
How to conduct a churn analysis
You can’t address churn without knowing what you’re working with. Your first step is to conduct a churn analysis to see where your business stands.
Research on customer loyalty shows that even a 5% increase in customer retention can boost profits anywhere from 25%-95%. Let’s start with the standard customer churn calculation.
You can segment and run various customer churn calculations for different time periods, customer groups, specific products, and more. Over time, these reports will form the foundation of long-term churn modeling to make broader forecasts about customer behaviors.
Your revenue churn calculation is similar.
These assessments are typically done on a monthly or yearly basis, but each company should choose a reporting window that aligns with their subscription models.
A yearly report won’t do much good for a company that predominantly sells month-to-month subscriptions.
Which churn metrics should you use?
Depending on your subscription service model, this answer will vary.
If all customers pay the same amount for your subscription, the results of both metrics will be the same. Companies in this category usually just track customer churn and leave it at that. Things get more complicated as you start segmenting your customers.
The most popular method of measuring churn is by customers, followed by revenue.
If you offer multiple subscription plans as most businesses do these days, you’ll need to measure both to get an accurate snapshot of your churn. There’s no other way to get the financial data you need to create the context for more detailed reporting and metrics, such as calculations for net revenue churn or customer life expectancy.
Regardless of your approach, consistency is required. You want to gather data to help establish historical trends that will support longer-term churn predictions and forecasting.
Of course, these types of calculations require that you have a healthy supply of customer data available, which is why you need to have a centralized subscription management platform that makes data analysis easy for your sales, IT, and marketing teams. It’s possible to do it by hand, but most larger companies will eventually need subscription analytics platforms to stay on top of their financial metrics.
Conduct assessments on the impact of churn on your business
We’ve discussed how to calculate churn and a few types of churn you’ll want to monitor, but how can businesses tell what churn rates are acceptable and what impact those rates have on business operations?
This framework helps businesses answer these questions, based on three simple, repeatable steps:
Acquisition rate comparison
Your first step is to assess the flow of customers coming in versus those going out. Start by comparing your churn rate with your customer acquisition rate (a metric defined as the number of new customers added over the same period churn is being measured), divided by the number of customers you had at the start of that period.
This gives you a broad measure of customer growth vs. loss and whether your churn rate may prevent you from reaching your other goals.
Past rate comparison
After the initial analysis stage, many companies find themselves in a state of paralysis—they have a huge amount of new information, but are still afraid to pull the trigger on a new pricing plan in case something goes wrong. That’s a mistake.
The lesson here is to be cautious with your existing customers, but there is no time like the present to apply new pricing to new customers.
Set a timeline for when your new subscription pricing will be available to new customers, and work backwards from there. It’s imperative to pilot your new pricing with both new and existing customers.
Make sure that your catalog lets you support both your old and new pricing, so that you can test, iterate, and repeat.
Peer rate comparison
In the final step, you’ll assess your own churn calculations against industry benchmarks to get a sense of how your company stacks up against key competitors.
When subscription businesses start discussing churn benchmarks, they often want to jump to this step to see how they compare against outsiders—but in our experience, this phase should only be performed after taking stock of your own situation. Without that essential foundational data, comparisons to third-parties are meaningless.
Explore the latest Subscription Economy Index for data on the growth metrics of hundreds of companies that you can use as part of your benchmarking.
How to reduce churn in your subscription business
In the early days of subscription sales, companies had poor churn management processes, and would attempt to prevent churn by making things hard for the customer: creating multi-step cancellation processes, obscuring cancellation information, requiring in-person communication to cancel, and so on.
We’re long past the point of considering these dark UX tactics as viable options. When customers want to cancel, make it easy for them to do so. You won’t win them back by frustrating them further.
Instead, subscription companies should examine their workflows to determine how to prevent customers from reaching the churn point in the first place.
Let’s look at a few concrete steps that can help keep customers on board.
Revamp your onboarding process
Is your onboarding process effective for your customers? Start by assessing its strengths and weaknesses and get feedback from customers who have gone through it. If it lacks personalization, communication, or education, it’s time to revamp it.
When onboarding customers, personalize the experience and communicate with them throughout the process. Set clear expectations and milestones for achieving goals. This will help customers understand what to expect from your product or service without overwhelming them.
Segment your most at-risk and valuable customers
The best way to reduce churn is to avoid it in the first place, but how can you predict when a customer might choose to leave?
They’ll tell you themselves—by way of the insights hidden in your customer relationship management (CRM) software.
Have customers struggled to make payments? Have they complained about services? How many times have they contacted support? Ideally, you’ll have a subscriber management platform that allows you to aggregate all customer insights across sales, billing, and support.
Modern analytics platforms use APIs and SDKs to extend into your existing business applications to make this process easier, pull information, and allow you to generate custom reports on churn, lifetime value, and other subscription metrics.
Backed by this information, you can create customer segments for those most likely to churn and those who are safe. This segmentation shows which customers may need more hands-on outreach and provides an easy method of prioritization and where to focus your attention.
Prioritize your existing relationships
When a customer says goodbye, many companies immediately seek new prospects to fill the gap. This is fine, but as we know, it costs far more to acquire a new customer than to retain an existing one. By some estimates, 5-25 times more expensive.
In other words, investments made in your existing customer base may yield substantially higher returns than those spent on your acquisition cycle. Set schedules for regular outreach within your subscription management platform, and find out how subscribers feel about their services.
You may also consider developing additional educational resources that further extend the value of your arrangement, such as webinars, demos, loyalty/incentive programs, and more, all to help them get excited about their partnership with your company.
Refine your subscription cancellation email and exit process
Sometimes customers cancel their subscription, even if you give it your best efforts, which is okay. At this point, your goal should be to learn from them and understand what forces drove them to cancel in the first place. Your subscription cancellation email is a great way to do it.
Create a template that hits all the obvious points—thank them for their service. But while you’re at it, ask them for details you can use to serve your existing customers better. If the customer is a high-value one, you may schedule an exit interview to connect directly with them. But either way, your mission is to get direct feedback that you can use to improve in the future.
Put some thought into this, but don’t overwhelm them. Keep things short, sweet, and personal. Many customers won’t bite, and with enough refining, you can develop a template that generates consistent results.
Minimize subscription churn with data-driven processes
Small amounts of churn may be acceptable as the cost of doing business, but churn can quickly spiral out of control when hidden problems go uncorrected.
To reduce churn, you need to collect and organize the data you have, get insights into your customers’ motivations, and predict how to focus your attention to meet customers’ needs before they leave. These subscription management efforts are important for your current and future business needs.
It’s become commonplace for companies to use more sophisticated software solutions to meet these goals. These subscription analytics software platforms offer a variety of out-of-the-box metrics for analyzing churn, as well as assessment tools for tracking and analyzing trends, including statistical models for predicting potential churn trends and segmentation tools for managing customers.
Subscription management platforms help bring together your key financial and performance metrics and get deeper insights into the motivations that drive customer behavior.
Equip your support and sales team with the best training and resources
One of the many mistakes businesses make is that they rate their support team based on a vanity metric—their speed on calls—that’s the number of calls a customer support team handles.
Ensure your sales and support team has the best training and resources to answer queries promptly and efficiently. Rather than quickly getting off the phone with customers, ensure your sales and support teams are able to connect with customers and more deeply understand their challenges and concerns. This can improve customer satisfaction and make a big difference to your churn rate.
Invest in a customer success team
Sometimes churn happens when customers think they’re no longer getting value for their money. This is where a customer success team is essential. Unlike support teams, who are mostly reactional to customer queries and technical issues, a customer success team proactively engages customers to ensure they get value from your product or service.
Why should you have a customer success team when you already have a support team?
This question often comes from businesses thinking they’re the same thing, or both can work interchangeably. Well, they are not always different in terms of KPI.
The customer success team focuses on helping customers get value for their money by understanding their goals and helping them realize them through constant support and guidance throughout the customer journey—while the support team involves troubleshooting and resolving issues.
What is a monthly churn rate?
Monthly churn rate is the percentage of customers who discontinue or end business with you in a given month. To measure the monthly churn rate, you will look at the number of customers who canceled or left in a given month divided by the number of customers from the start.
For example, suppose your company has 500 customers by the beginning of the month, and by the end of the month, 100 canceled their subscription. Your monthly churn rate will be:
Monthly churn rate = (number of customers lost in that month ÷ total number of customers at the start of the month) x 100
Monthly churn rate = (100 ÷ 500) x 100 = 20%
What is an annual churn rate?
Annual churn rate is the percentage of customers who discontinue or end business with you in a given year. To measure the annual churn rate, you want to get the number of customers who left over the year divided by the number of customers at the beginning.
For example, if your company has 1000 customers at the beginning of the year, and by the end of the year 150, canceled or left, your annual churn rate will be:
Annual churn rate = (number of customers lost in that month ÷ total number of customers at the start of the month) x 100
Annual churn rate = (150 ÷ 1000) x100 = 15%
What’s considered a “good” (or acceptable) churn rate?
There are varying opinions and views on what’s considered a good or acceptable churn rate.
For instance, the most common industry benchmark is a 5% annual churn rate. But, this number isn’t accurate for all businesses.
In fact, there are reports of some big SaaS companies having a monthly churn rate of 5%.
The Subscription Economy Index report shows that the business services and manufacturing industries have the lowest (16.2% and 20.4%) churn rates. While the media industry had a churn rate of 37.1%, and the publishing industry had a churn rate of 28.2%, recording the highest.
The recent 2022 KBCM Technology Group survey, which collected responses from companies with revenue over $5M, shows a median annual revenue churn rate of 14% was reported among 173 respondents, and a logo churn rate of 13% among 79 respondents.
No one-size-fits-all approach for a “good” or “acceptable” churn rate applies to all industries and businesses. As shown earlier, churn rate varies across the industry as it is impacted by various factors such as business model, pricing, acquisition, and industry.
Ideally, a lower churn rate is considered better—achieving a negative churn should be your ideal outcome as it indicates that a business’s revenue from an existing customer exceeds the revenue lost to cancellation or downgrades.
FAQs about churn rate
Is 5% an acceptable monthly churn rate?
Yes, 5% can be an acceptable monthly churn rate for startups or early SaaS companies and businesses that target SMBs. At this stage, you’re still working out your product-market fit and building a customer base, so this rate can be an ideal monthly churn rate.
Even if this is acceptable for some businesses, you shouldn’t become complacent with a 5% monthly churn rate. As your subscriber base grows, you should work to achieve at least a 5-7% annual churn rate.
On the other hand, for enterprise SaaS companies, you want to work towards achieving less than a 5% annual churn rate instead.
Customer lifetime value and churn rate
There’s an inverse relationship between customer lifetime value and churn rate. What this means is—as one increases, the other decreases. For example, a high churn rate would translate to a low customer lifetime value.
Customer lifetime = (1 ÷ Churn rate)
What is subscriber churn?
Subscriber churn refers to the rate at which subscribers cancel or refuse to renew their subscriptions.
What is the benchmark for subscription churn rate?
According to the Subscription Economy Index, the benchmark for subscription churn rate is 6.4% in 2022.
How often should I calculate my churn rate?
You can calculate your churn rate monthly. This way, you can monitor short-term trends, but will only partially get the business’s long-term performance.
You may also calculate the churn rate quarterly or annually for a long-term view and a more comprehensive analysis. Because of its larger dataset, it helps inform strategic decisions to understand your retention strategy’s effectiveness better and assess your year over year business performance.
How do I figure out why customers churn?
To figure out why customers churn, you may conduct a customer survey, ask them for exit interviews, analyze support tickets, and track their behavior and engagement metrics.
Before devising any actionable plan to reduce churn, it’s crucial to understand why customers churn in the first place.
What can churn teach you about your business?
Churn can teach you much about your business—it’s a critical SaaS metric to track your success. It can teach you the underlying issues behind customer dissatisfaction or disengagement. Churn can also tell you the effectiveness of your business retention strategy.